Axes Calibration
Click points to select and use cursor keys to adjust positions. Use Shift+Arrow for faster movement. Click complete when finished.
Manual Mode
Data Points: 0
Edit Image
Automatic Mode
Mask
Color
Distance
Algorithm
Data Points: 0
Measure Distances
Measure Angles
Detect Grid
Mask
Color
| Horizontal | |
| Detection Width | |
| Line Width |
| Vertical | |
| Detection Width | |
| Line Width |
Load Image File
Magnified View Settings
Magnification: | Times |
Crosshair Color: |
|
Choose Plot Type
X and Y Axes Calibration
Enter X-values of the two points clicked on X-axis and Y-values of the two points clicked on Y-axes
| Point 1 | Point 2 | Log Scale | |
| X-Axis: | |||
| Y-Axis: |
*For dates, use yyyy/mm/dd format (e.g. 2013/10/23 or 2013/10). For exponents, enter values as 1e-3 for 10^-3.
Scale Size
Point 1
R1:
Θ1:
Point 2
R2:
Θ2:
Degrees Radians
Clockwise
Select Range of Variables
Axes Orientation
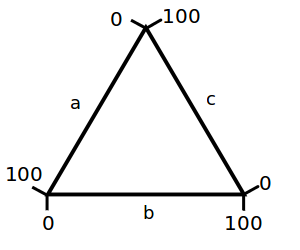 | 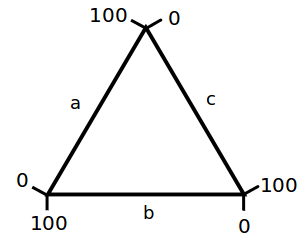 |
Normal | Reverse |
Range of Variables
0 to 1 | 0 to 100 |
Acquired Data
Sort by: Order:
Date Formatting:
Variables:
*Plotly is a secure data analysis and graphing site with data sharing and access controls.
Visit http://plot.ly for details.
Measurement Data
Align X-Y Axes
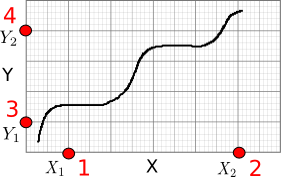
Click four known points on the axes in the order shown in red. Two on the X axis (X1, X2) and two on the Y axis (Y1, Y2).
Align Map To Scale Bar

Click on the two ends of the scale bar on the map.
Align Polar Axes
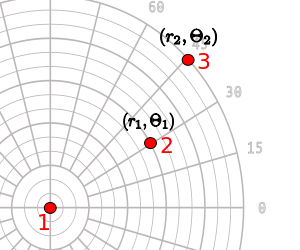
Click on the center, followed by two known points.
Align Ternary Axes
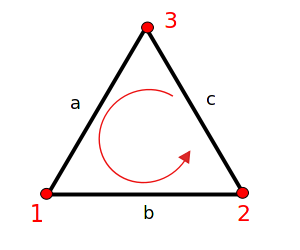
Click on the three corners in the order shown above.
WebPlotDigitizer - Web Based Plot Digitizer
Version 3.4 (beta)
This program is distributed under the GNU General Public License Version 3.
Copyright 2010-2014 Ankit Rohatgi <ankitrohatgi@hotmail.com>
http://arohatgi.info/WebPlotDigitizer
Specify Color
R: G: B:
Dominant Colors: