SeeGraph is a 3D unweighted graph visualization and interaction package primarily used for hypothesis testing of gene correlation data.
This package makes extensive use of OpenGL and therefore a modern video card with an updated OpenGL driver is highly recommended.
It has been compiled for several operating systems and available for download below.
For other operating systems, please contact Joshua New.
Download Page
Input Files
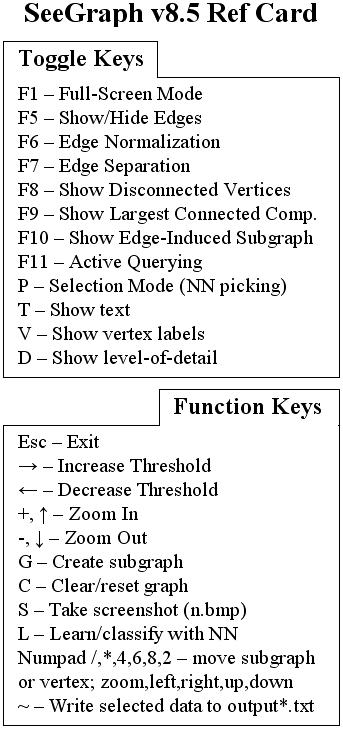
Cheat Sheet
-
Mouse Interaction
Rotation - click and drag on the graph.
Querying - click and drag the desired data feature in the query panel along the top;
information regarding the feature being manipulated is displayed below the queries.
Range queries color-code the vertices with the top query taking highest priority so lower queries should be less stringent.
Block Tridiagonalization - click and drag square selections on the BTD panel along the bottom to view the corresponding subgraph.
Neural Network selection - press the 'P' key to enable picking; left-click vertices representing examples and middle-click
vertices representing counter-examples; press the 'L' key to learn and classify the data.
Note that picking disables rotation; press 'P' again to rotate.
-
Common Key Commands (ordered by frequency of use)
Left/Right Arrows - change the edge threshold (displayed at the top).
F6/F7 - change color-mapping for edges, currently using a blue-to-red cold/hot color table;
F6 toggles normalization, F7 toggles negative-edge separation.
For example, consider edge weights [-1,-.85],[.85,1]. Color-table mappings consist
of 4 possibilities (initialized to F6 and F7 being on, denoted as 11):
11 - [0,0.5],(0.5,1]; 10 - [0,1]; 01 - [0,.15],[.85,1]; 00 - [0.85,1]
G - create subgraph of the current working graph. Currently, only the first 4 subgraphs are displayed, clockwise
starting at the top right.
C - reset the query and BTD selections to go back to the original graph.
Up/Down Arrows, +,- - Zoom in and out.
V - show vertex labels so we know what objects we're talking about.
S - take a screenshot. Consecutive screenshots are saved as bitmaps of consecutive numbers but resets on program restart.
Esc - Quit the application.
-
Advanced Key Commands
D - create a level-of-detail graph from all subgraphs.
F9 - show largest connected component.
F10 - show the edge-induced subgraph.
F11 - change query to update on mouse move rather than mouse release.
Keypad (2,4,6,8,*,/) - move last vertex of LoD graph or new subgraph; down,left,right,up,toward camera, away from camera, respectively.
-
Utility Key Commands
F1 - toggle fullscreen mode.
F5 - show/hide edges.
F8 - show disconnected vertices.
T - show/hide text (#verts, #edges, fps, etc.).
~ - save working graph data to "output-VertList.txt" and "output-EdgeList.txt".
K - rotate 3D view and take screenshots for animated gif creation.
|
|
