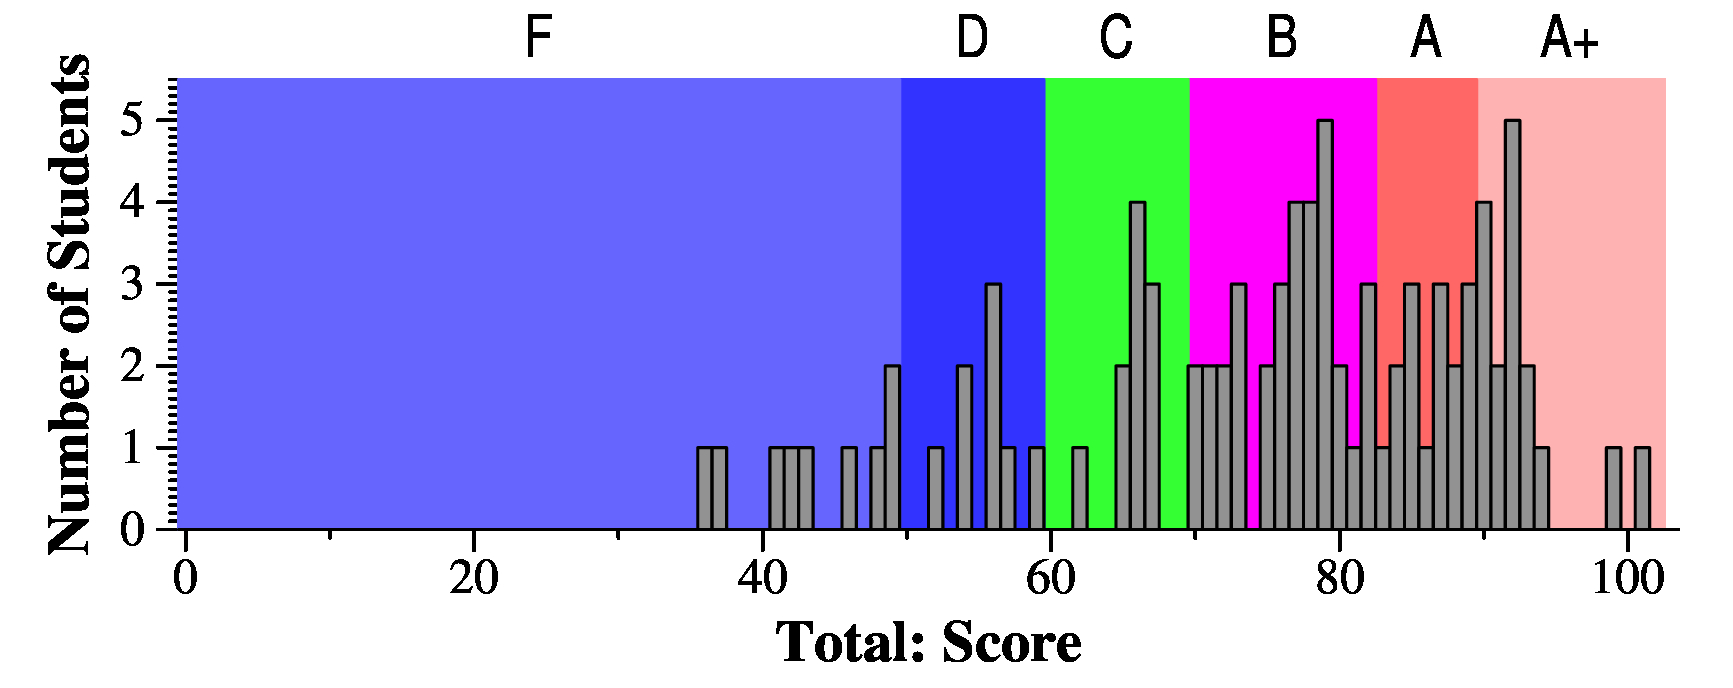
As far as my exams go, this one was pretty straightforward. Here's the mapping of
scores to grades:
A+: 90 - 103
A: 83 - 90
B: 70 - 83
C: 60 - 70
D: 50 - 60
F: 0 - 50
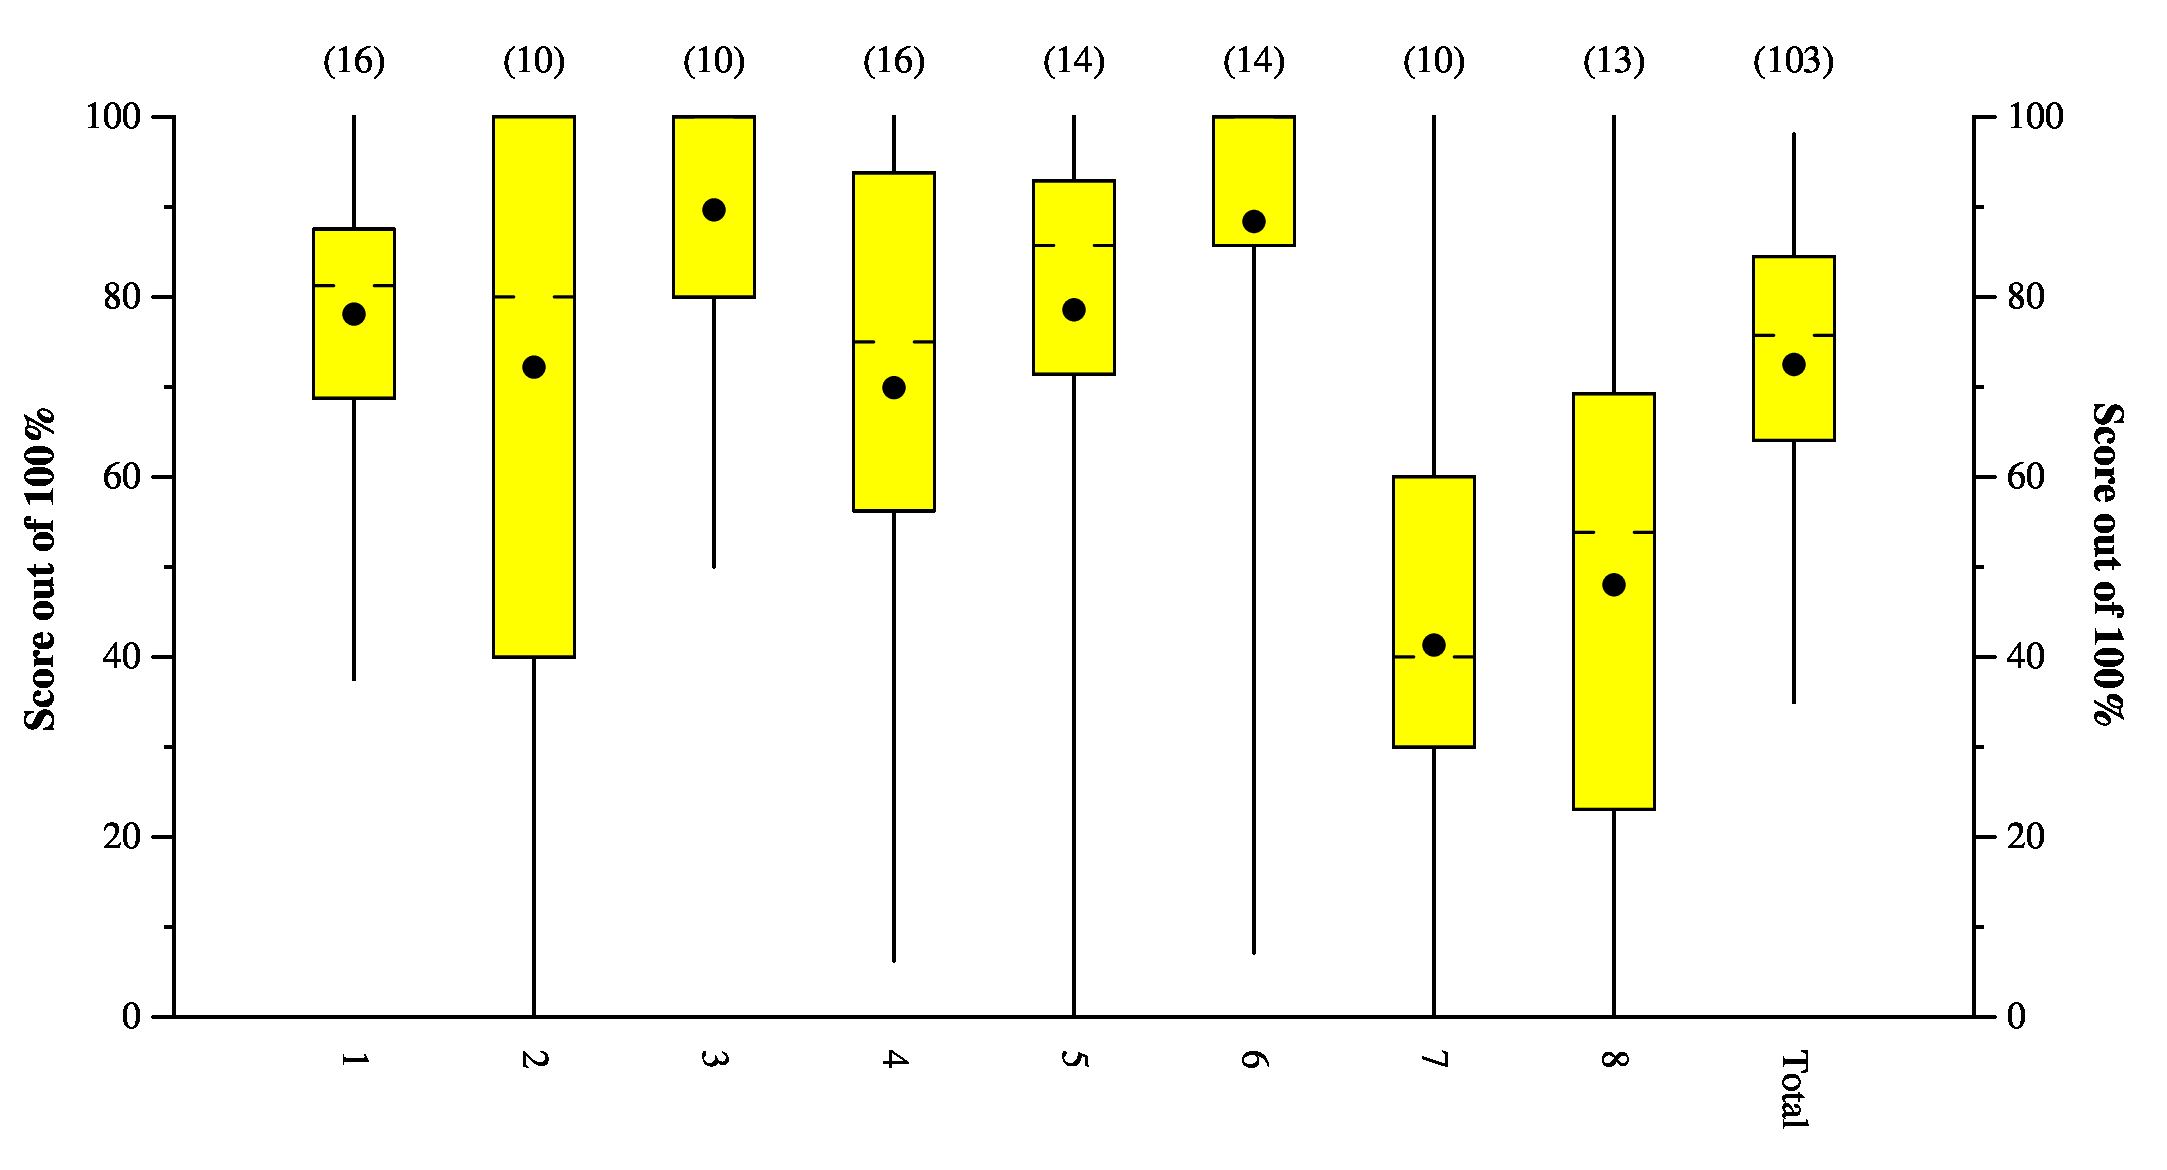
Tukey Plots
This is a Tukey Plot, which has lines to the max and min, yellow box denoting
the 1st and 3rd quartiles, hash marks at the median, and dot at the mean.