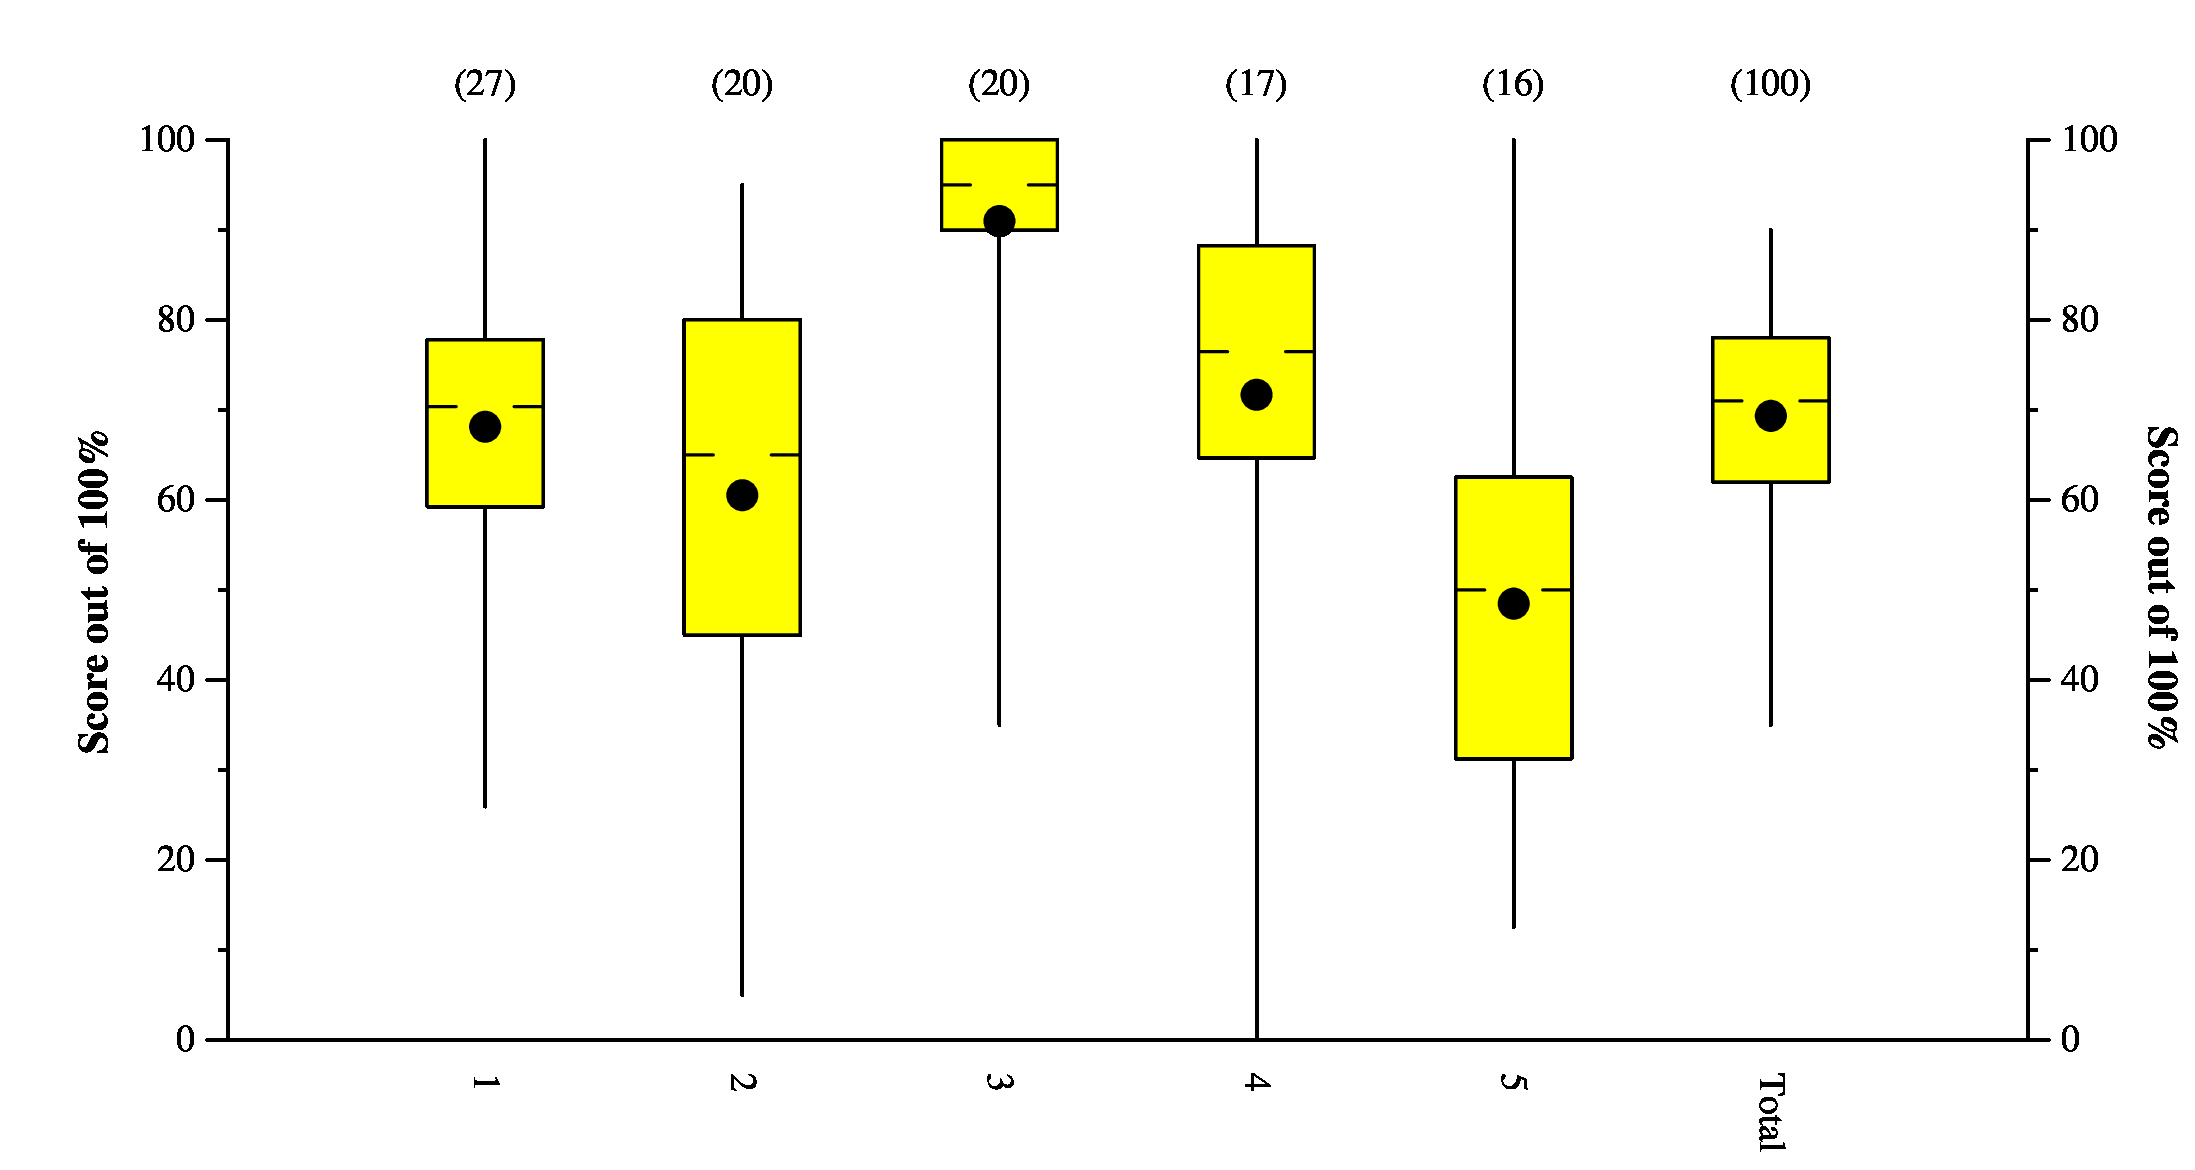
This is a Tukey Plot, which has lines to the max and min, yellow box denoting the 1st and 3rd quartiles, hash marks at the median, and dot at the mean.
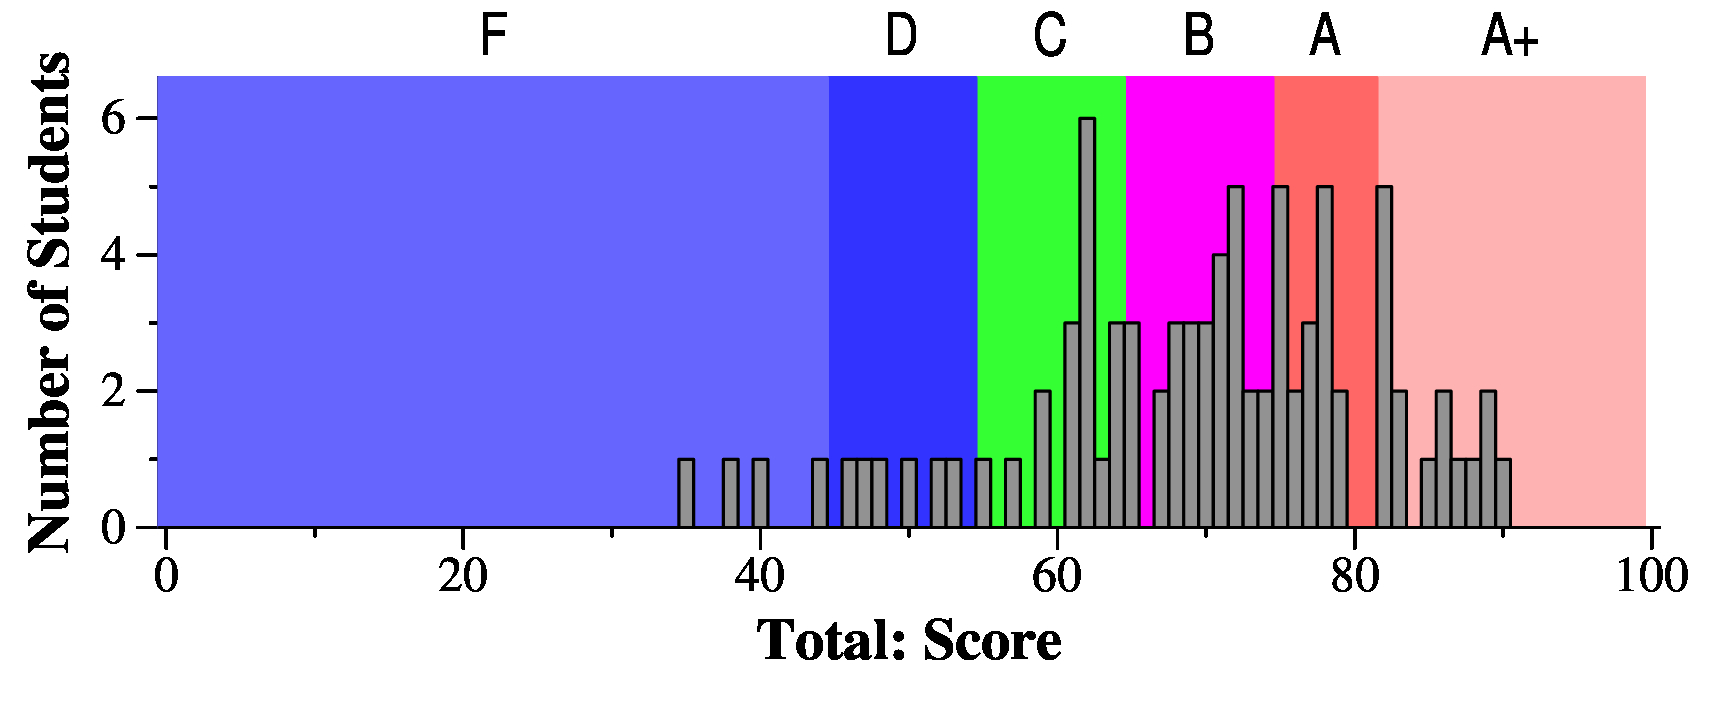
In the "answers and grading", there are histograms of scores for each question.