 |
Here is the mapping of scores to grades. I have been quite lenient here to account for the time pressure.
|
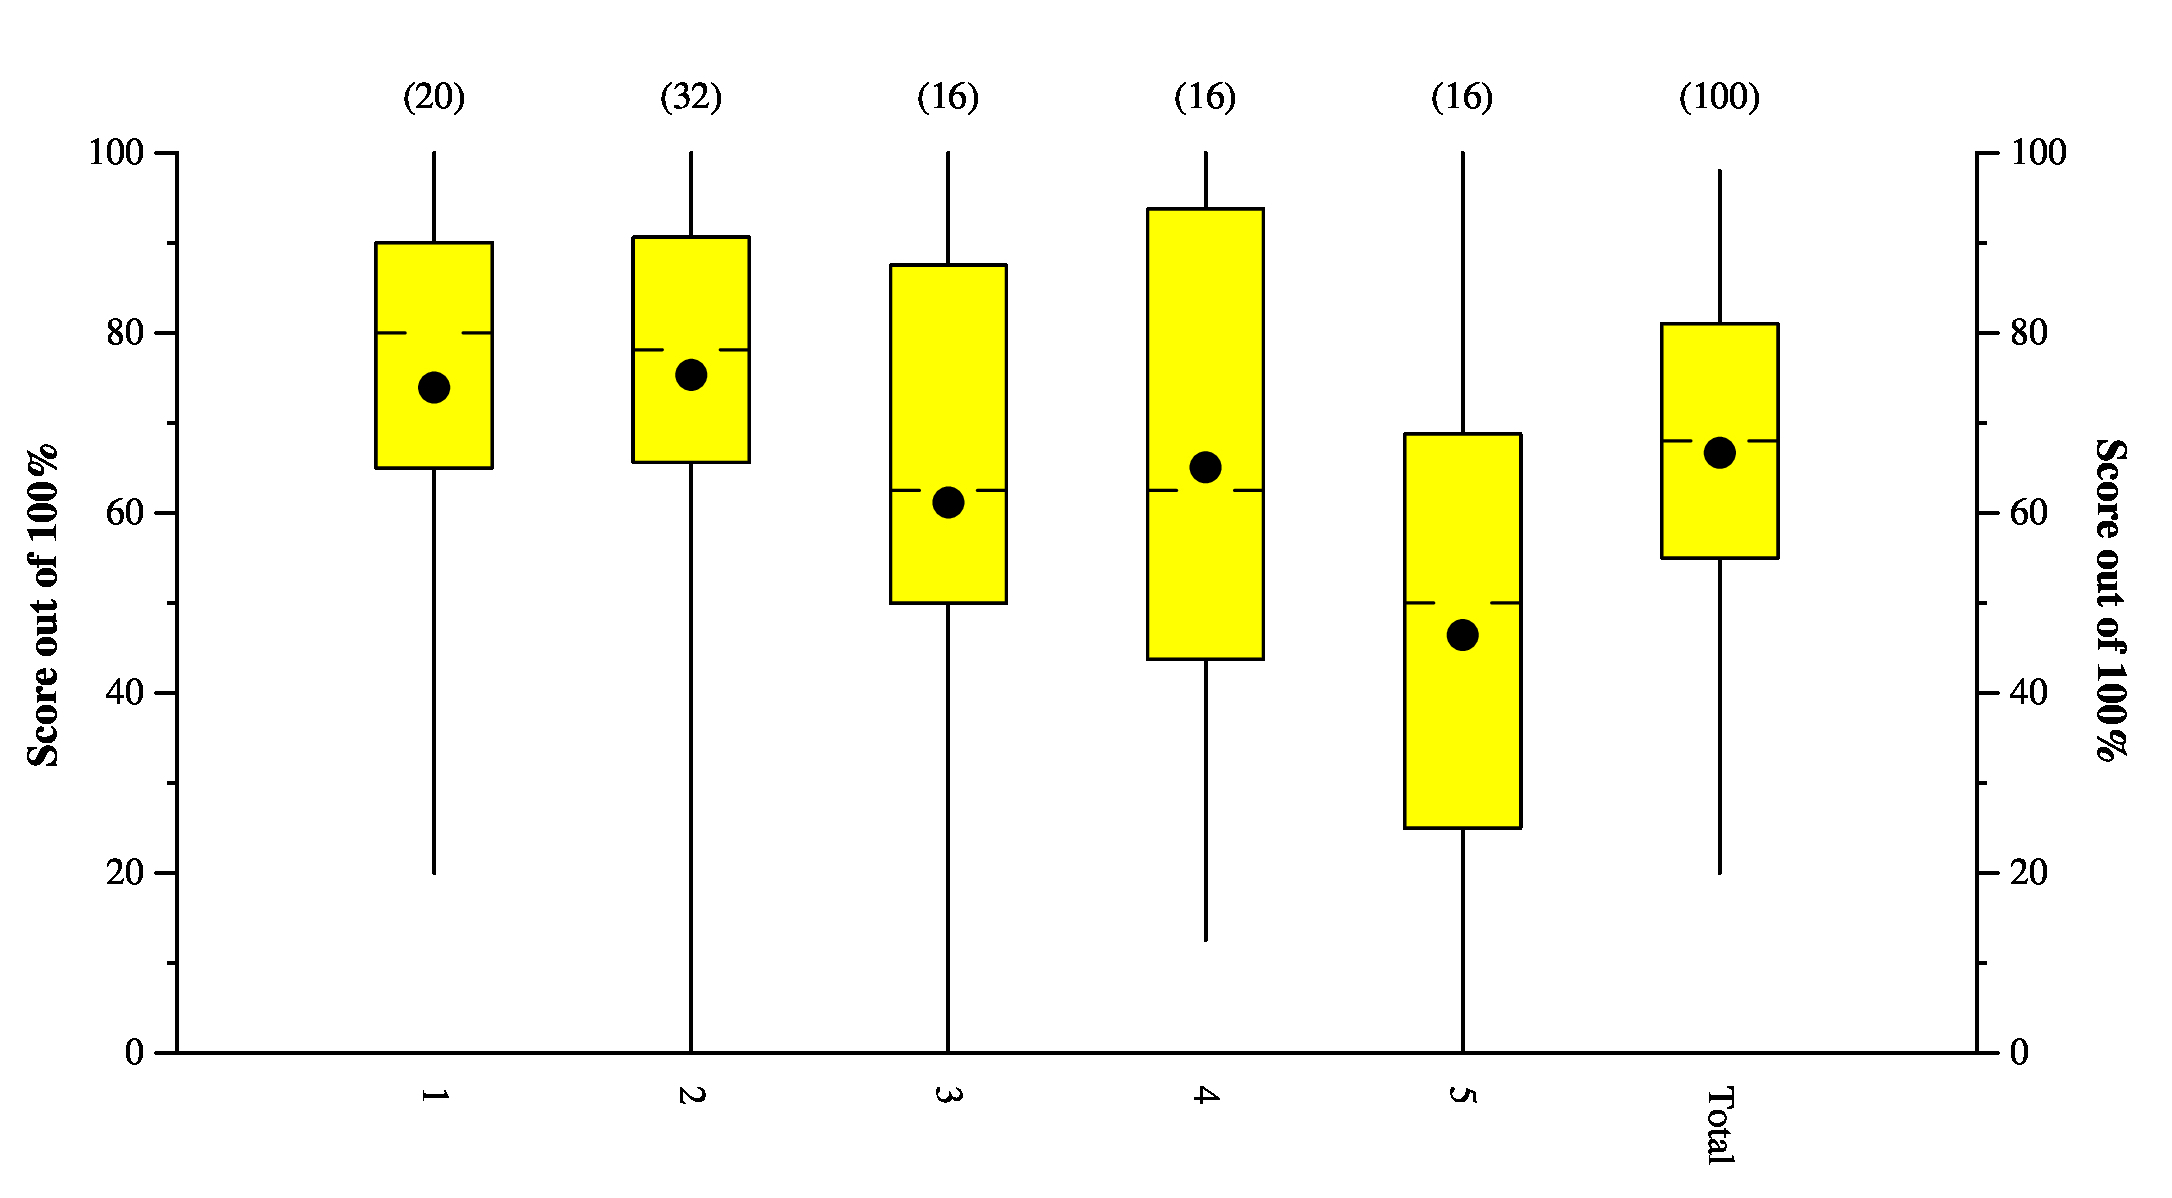 |
This is a Tukey Plot, which has lines to the max and min, yellow box denoting
the 1st and 3rd quartiles, hash marks at the median, and dot at the mean.
In the answers and grading, there are histograms of scores for each question.