CS360 Midterm Exam #2 -- March 11, 2014
Files
Comments
This exam pretty much hit the mark from my point of view. It was challenging, but
did a good job to me of conveying how you're thinking. Here's the mapping
of scores to grades.
- A+: Above 50 - Give yourself a pat on the back. That's a great score, and those
two 58.5's are truly stellar performances.
- A: 42 to 50
- B: 35 to 42
- C: 25 to 35
- D: 20 to 25
- F: Below 20
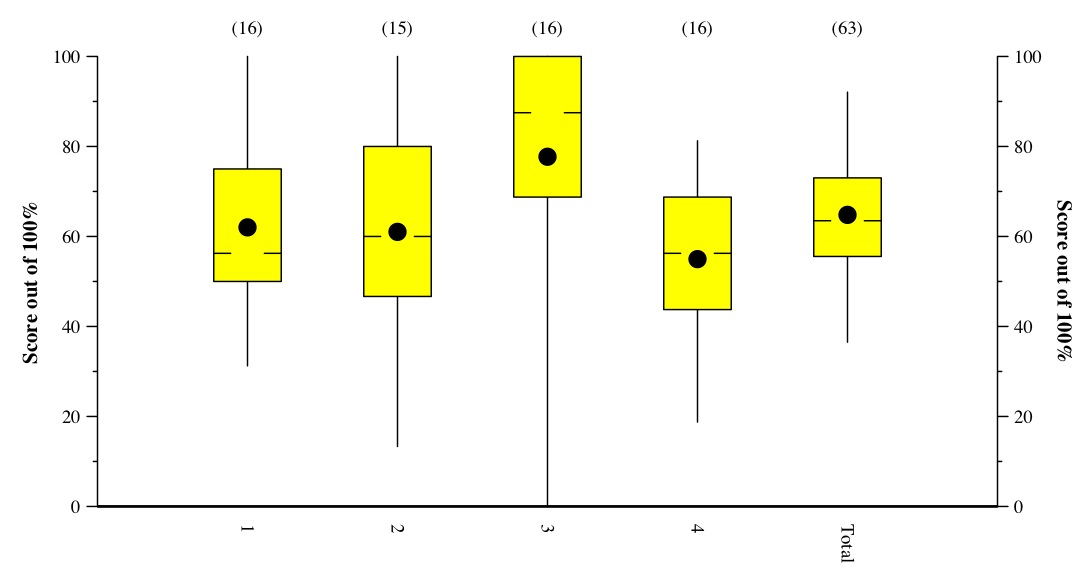
Tukey Plots
This is a Tukey Plot, which has lines to the max and min, yellow box denoting
the 1st and 3rd quartiles, hash marks at the median, and dot at the mean.
In the "answers and grading", there are histograms of scores for each question.