TCO 2017, Round 1A, 1000-Pointer (PolygonRotation)
James S. Plank
Sun Apr 9 22:05:35 EDT 2017
This is a fun problem. To solve this in the given time period, you need to have
your A game on, and probably to have written a line-intersection procedure already.
I have one now...
Let me walk you through a solution, by way of examples. I have put these examples
into main.cpp with the given numbers.
Example 4
Here we have just four points, none of which are negative:
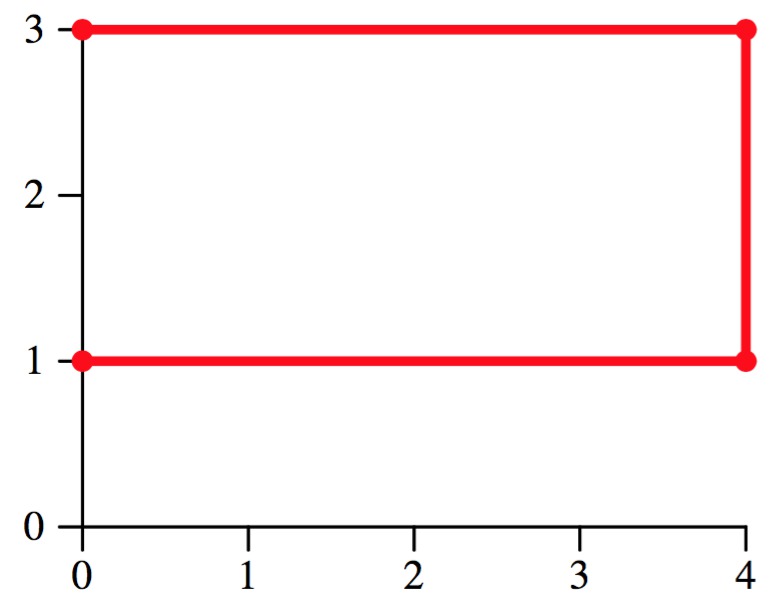
(0,3), (4,3), (4,1), (0,1)
This makes the following rectangle:
I think it's pretty clear that when you rotate this around the Y axis, you have a cylinder
with a height of two and a radius of four. Its volume will be π (4)2(2) = 100.53.
Example 5
Now only three points, none of which are negative:
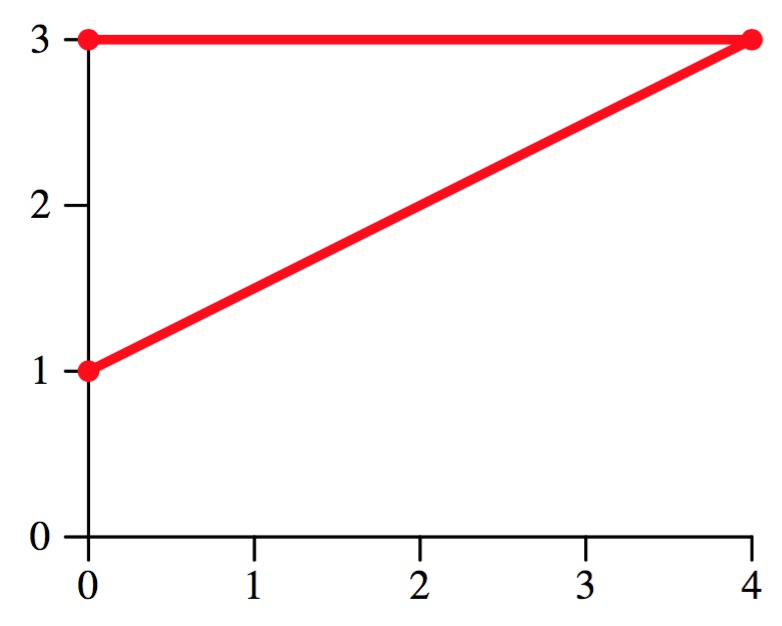
(0,3), (4,3), (0,1)
This makes the following triangle:
When you rotate this about the Y axis, you get a cone with radius four and height two. I certainly
didn't have the volume of a cone memorized, but google told me that it's π r2h/3.
In this case: 33.51.
Example 6
Back to four points, but again, none of them are negative:
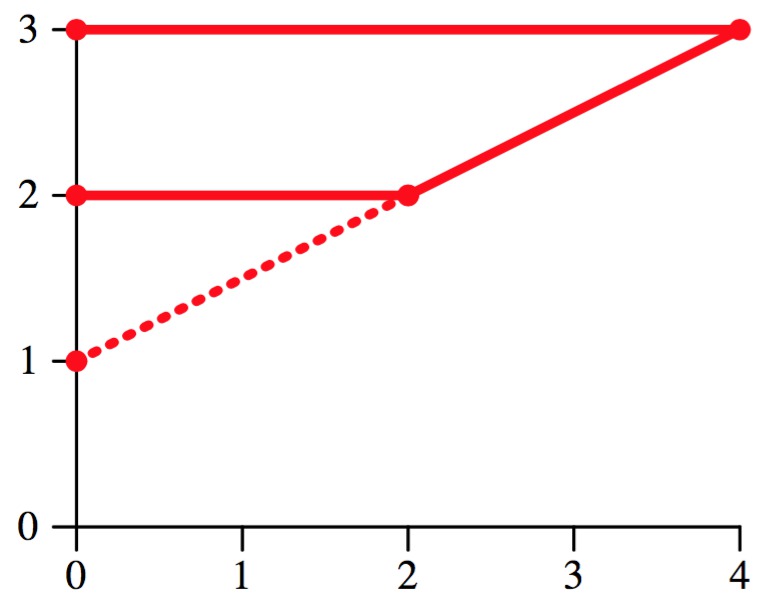
(0,3), (4,3), (2, 2), (0, 2)
This makes the following trapezoid:
When you rotate this about the Y axis, you get a chopped off cone. To calculate the volume, follow
the dotted line to the Y axis. Now there are two cones -- one of height 1 and radius 2, and one of
height 2 and radius 4. Subtract the smaller from the larger, and you get the volume of the chopped
off cone:
π 422/3 - π 221/3 =
33.51 - 4.19 = 29.32.
This is an important case, so let's consider it a little further. When you see a trapezoid,
it will turn into a chopped-off cone. To calculate the volume, you'll need to take the two
rightmost points, turn them into a line, and then find out where they cross the Y-axis.
That will give you a Y value, which is either the bottom or the top of two cones, one of
which is the superset of the other. Calculate the volume of these two cones and their difference
is the volume of the chopped-off cone. The next example will give you a little more
practice.
Example 7
Here's a final initial example.
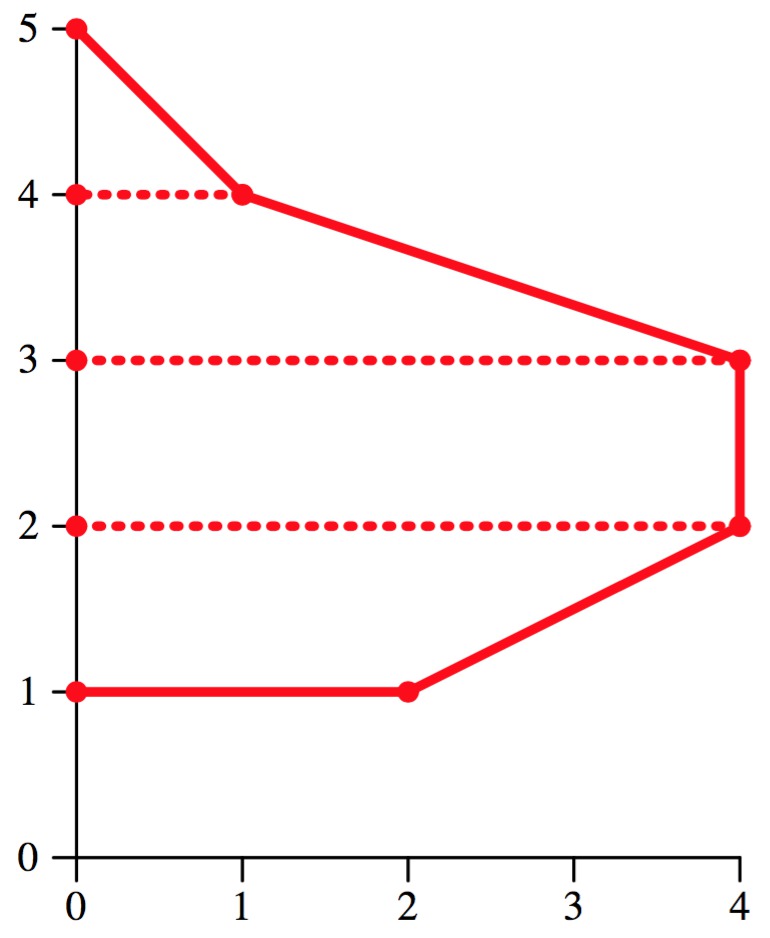
(0,5), (1,4), (4,3), (4,2), (2,1), (0,1)
As you can see by the horizontal lines, you can break this up into a triangle, two
trapezoids and a rectangle:
Let's calculate their volumes when you rotate them about the Y axis:
- The triangle on top becomes a cone: π (1)2 (1/3) = 1.05.
- The trapezoid from y=3 to y=4 becomes a chopped-cone. The line from (4,3) to
(1,4) intersects the y axis at 4.33333. So the volume of the chopped cone is:
π (4)2 (1.333333/3) -
π (1)2 (0.333333/3) = 21.99.
- The rectangle from y=2 to y=3 becomes a cylinder: π (4)2 (1) = 50.27
- The bottom trapezoid is the same one as in Example 6 above:
π (4)2 (2/3) -
π (1)2 (1/3) = 29.32.
Their sum is 102.63.
Now is a good time for your to write some code: Given a collection of x/y points, where the
Y points are ordered from top to bottom as in the program, and none of the x values are negative,
calculate the volume when the given line is rotated about the y axis. You do this by
chopping up the line into triangles, rectangles and trapezoids, and using the formulas above.
You actually don't need separate code for cones and chopped-off cones -- you can simply consider
a triangle to be a trapezoid whose top/bottom point is on the y axis.
This is one place where I used some code that calculated the intersection of two lines -- to
find the point where the trapezoid's line intersects the Y axis, intersect the point with a
vertical line. You may find it easier at this point, to simply calculate the point where the
line crosses the y axis directly.
Example 8 - Adding some negative numbers
Now, let's try the following points:
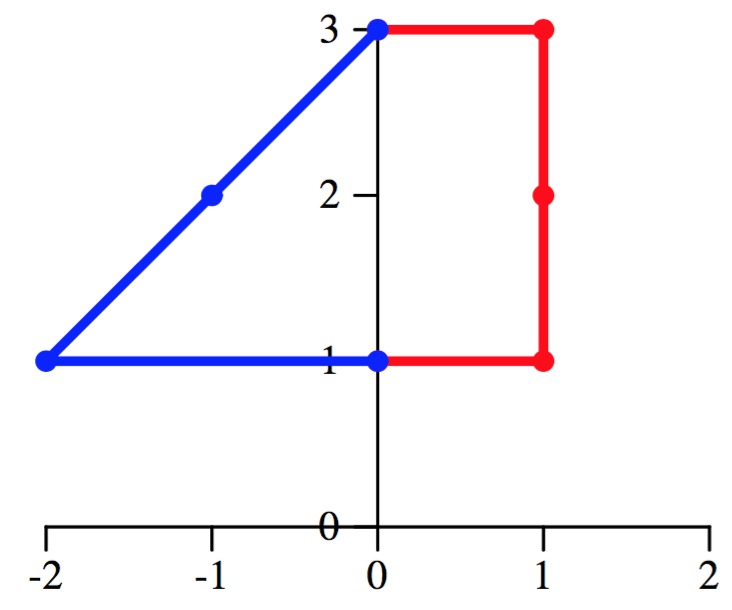
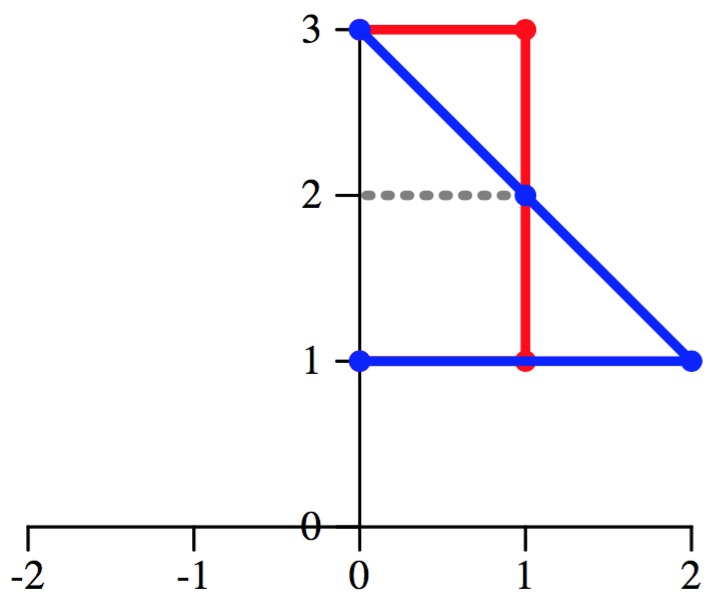
(0,3), (1,3), (1,2), (1,1), (0,1), (-2,1), (0,3)
I'm going to color the negative line blue and the positive one red, and then I'm
going to do the same thing, only I'm going to turn the negative numbers into positive numbers:
As you can see, turning the negative numbers into positive numbers is ok, since you are rotating
everything about the y axis. This gives you two distinct regions:
- The region from y=1 to y=2, where the blue line is greater than the red line, which
will result in a trapezoid. The resulting chopped cone has a volume of
π (2)2 (2/3) -
π (1)2 (1/3) = 7.33
- The region from y=2 to y=3, where the red line is greater than the blue line,
which results in a rectangle. The resulting cylinder has a volume of
π (1)2 (1) = 3.14
Their sum is 10.47.
Example 9 - As complex as it's going to get
Finally, here is example 9, which is equal to example 2 from the from the Topcoder writeup,
only I have transposed the points up by four, so that the graph is less messy. Here
are the points:
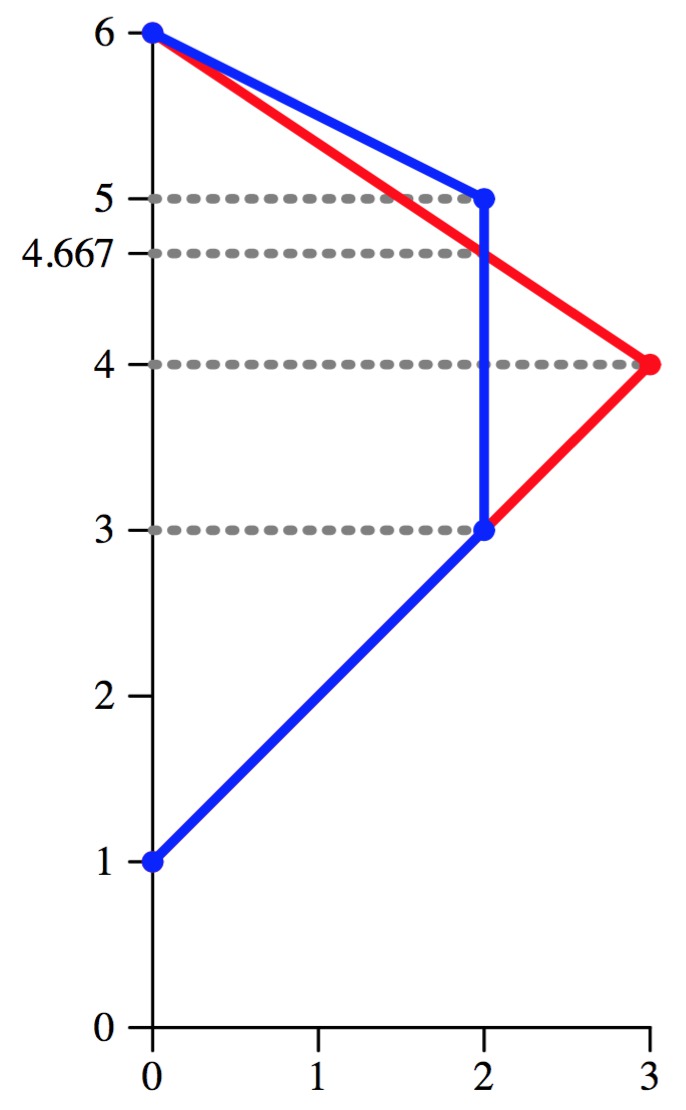
(0,6), (3,4), (0,1), (-2,3), (-2,5)
And here is the graph, with the blue points negated:
This graph has two things that make it a little harder than example 8:
- There are blue points at y values where there are no red points (e.g. (-2,5)), and
there are red points at y values where there are no blue points (e.g. (3,4)).
- There is a point where the red and blue lines cross, which is at a y value that
is not in either the red or the blue lines.
To handle these issues, my code had the following structure:
- First, create the red and blue lines, negating the x values in the blue set.
I stored these both as maps, whose keys were the y values and whose values were the
x values. If there were x values corresponding to multiple y values, then I only
included the largest x value -- this can only happen at the top or the bottom of
the graph, as a result of the problem specification and constraints.
Using example 9, the two multimaps are as follows (remember, the first value is the y
value, and the second is the x value):
- Red: [1,0][4,3][6,0]
- Blue: [1,0][3,2][5,2][6,0]
- Next, I ran through the values in the red map, and if there were any y values that
weren't in the blue map, then I calculated what they would be and inserted them.
I used find() and upper_bound on the blue map to search and see if a
y value was there, and if not, to find the two values surrounding it, so that I could
calculate its x value and insert it into the map.
I did the same thing with the values in the blue map, making sure to insert them into
the red map if they didn't exist already.
In example 9, this led to the following red and blue maps (again, the first value is
the y value, and the second is the x value).
- Red: [1,0][3,2][4,3][5,1.5][6.0]
- Blue: [1,0][3,2][4,2][5,2][6,0]
- Next, I looked at each pair of line segments for consecutive y values in the map.
If the two lines crossed, then I put the intersecting point into both maps.
To do this, I had to write a point intersecting procedure. In example 9, this
adds the point (2,4.667) into both maps:
- Red: [1,0][3,2][4,3][4.667,2][5,1.5][6.0]
- Blue: [1,0][3,2][4,2][4.667,2][5,2][6,0]
- Finally, I traversed the maps, and for each pair of consecutive y values, I
determined which map -- red or blue -- had the greater line segment. I used
that segment to determine which shape to add to the volume: cylinder or cone/chopped-cone.
The reason that I set up the maps the way I did was that for each pair of consecutive
y values, the red and blue lines don't cross, and therefore one is strictly greater
than or equal to the other.
Here's example 9, going from bottom to top:
- Y values 1 to 3: The red and blue segments are the same: (0,1)-(2,3). This is
a cone whose volume is 8.38.
- Y values 3 to 4: Now the red segment is strictly greater than the blue segment:
(2,3)-(3,4). This is a chopped cone
whose volume is 19.90.
- Y values 4 to 4.667: The red segment is still greater than the blue segment:
(3,4)-(2,4.667). This is a chopped cone
whose volume is 19.90.
- Y values 4.667 to 5: Now the blue segment is greater. This is a cylinder whose
volume is 4.19.
- Y values 5 to 6: The blue segment is greater. This is a cone whose
volume is also 4.19.
The total volume is 49.92 (In this writeup, I've been showing two decimal digits of
precision. Obviously, you'll be using doubles for this, and if you print them out,
you'll see more digits of precision).
I don't give you a solution for this one, because this may turn into an honors lab problem.
The good thing is that you can use all of the examples above to help you write and debug
your code incrementally.