
This webpage hosts data and models to be used for the 2021 IEEE-NASPI Oscillation Source Location (OSL) Contest. For complete contest info and registration, please visit: https://www.naspi.org/node/890
News:
- Tied for 1st place: Team RPI (Denis Osipov, Stavros Konstantinopoulos & Joe Chow) from Rensselaer Polytechnic Institute;
- Tied for 1st place: Team Woodpecker (Honggang Wang, Shaopeng Liu & Gang Zheng) from General Electric;
- 3rd place: Team FIUBA (Pablo Gill Estevez, Pablo Marchi & Cecilia Galarza) from University of Buenos Aires.
Contest Objective:
Oscillations are a significant concern for reliable power system operation. This contest was organized to advance the electric power industry's ability to respond appropriately when oscillations occur. Contestants will be presented with realistic and challenging cases to help them evaluate and refine their methods. The contest will highlight robust methods that can be adopted by system operators and reliability coordinators to improve system reliability.
With these objectives in mind, solutions should focus on providing actionable information for mitigating oscillations in the online environment. Based on available PMU measurements, successful methods will correctly characterize oscillations and identify their sources (if applicable) in a way that is practical for real-world deployment. This requires that the source be identified as accurately as possible given the available data, whether that's to a specific generator, load, power plant, substation, or area. Successful methods will handle real-world constraints such as limited system observability, limited topology information, imperfect measurements, and the simultaneous occurrence of system disturbances. The test cases have been designed to reflect these real-world challenges. Reliable methods that are robust to these conditions will provide a significant benefit to the reliability of power systems.
About the Test System:
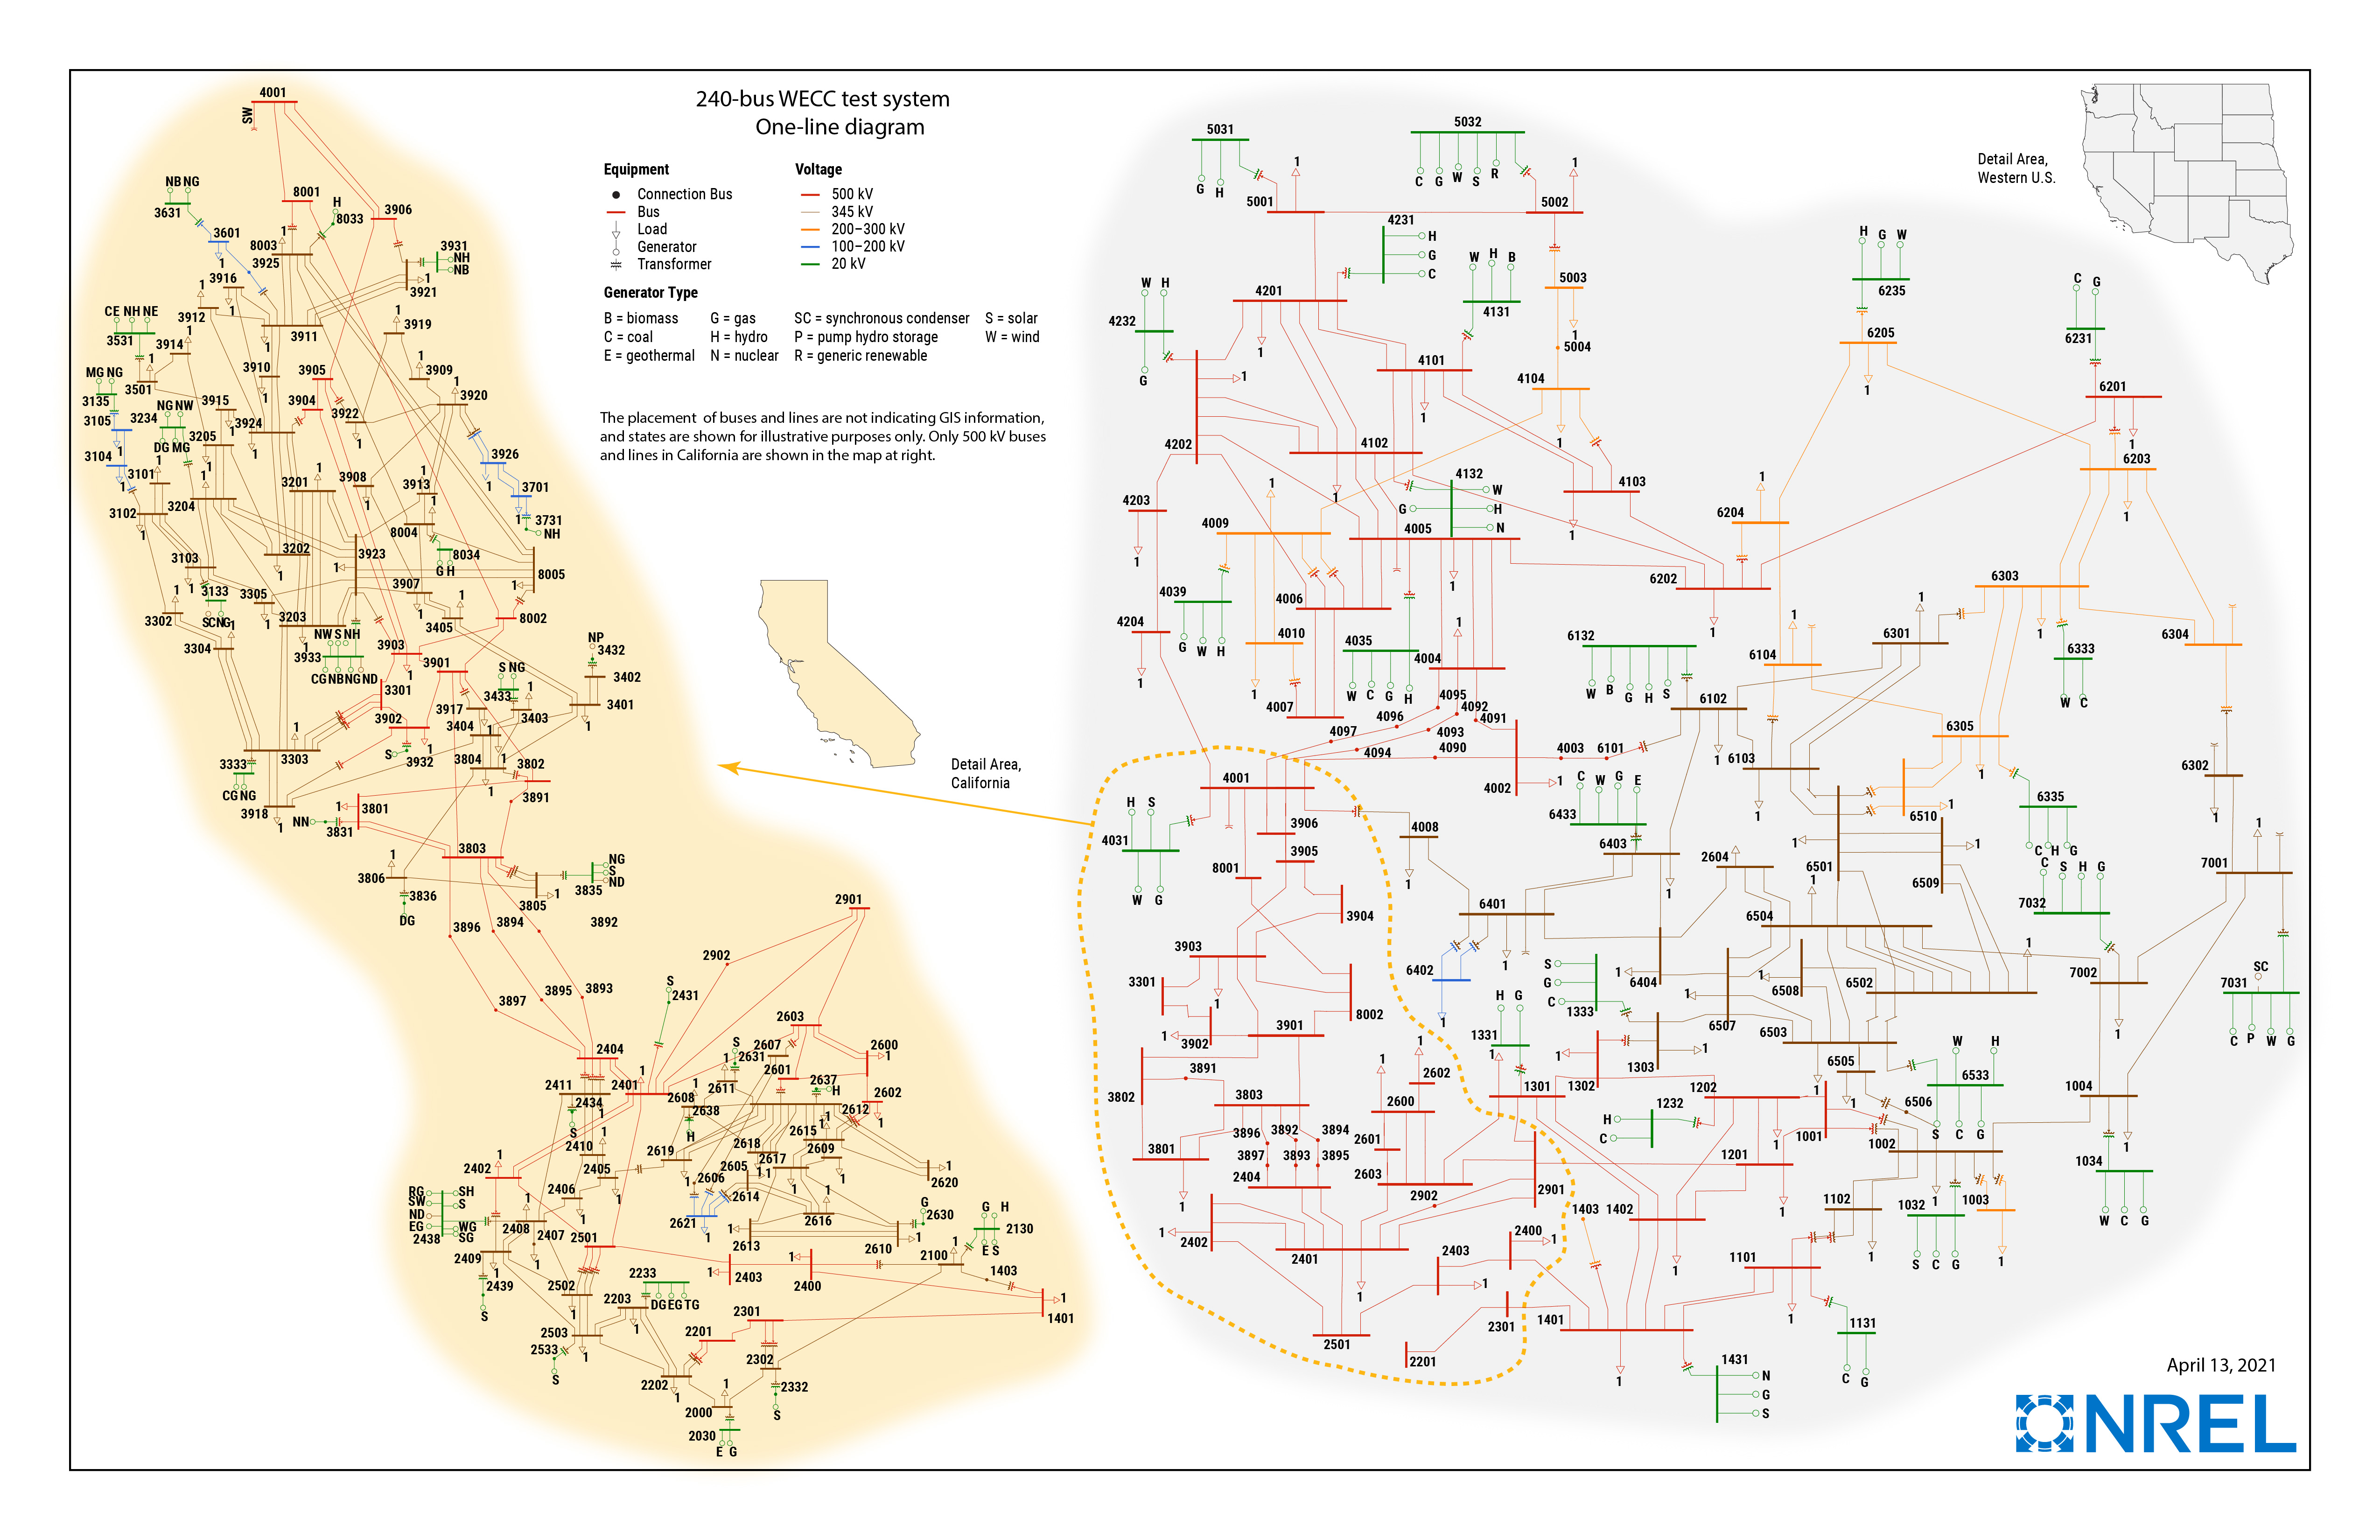
All test cases used for this contest were generated by simulating a WECC 240-bus test system [1] developed by NREL based on reference [2]. The system has 243 buses, 146 generating units at 56 power plants (including 109 synchronous machines and 37 renewable generators), 329 transmission lines, 122 transformers, 7 switched shunts and 139 loads. A base case of the test system can be accessed from NREL model release webpage.
Note that the contest committee has made the following changes to the original base case:
Included in the NREL model webpage download:
Not Included in the NREL model webpage download:
The following provides a one-line diagram on the entire system topology, except for the CA area whose detailed topology will be posted here in a separate figure before April 19, 2021.
About Test Cases:
There will be a dozen test cases for the contest. For each case:
Observability:
The system consists of four areas: NORTH, SOUTH, CALIFORNIA, and MEXICO. Synthetic PMU measurements provide partial observability to the system in all four areas including the following. Monitored buses and branches are also summarized in an EXCEL file.
Pro tips:
Sample Data Set:
Sample data set is for you to get familiar with the data format and the system. The final contest data set only contains synthetic PMU data.
Contest Data Set and Solution Submission Instructions
Q&A
Q1: Can the small-signal analysis (SSA) result for the test system be released?
A1: Yes. We have prepared the SSA result for the test system using SSAT by Powertech Labs. Note that frequency range (0.01Hz, 10Hz) and damping ratio range (0%, 20%) were used as filters, and the resulting 97 modes were included in the first sheet. Mode shapes, participation factors and left eigenvectors of 30 modes whose frequencies<1.5Hz, among these 97 modes, were respectively included in the second and following sheets.
Q2: What do the machine ID acronyms mean?
A2: If there is only one letter, this letter represents its fuel type. If there are two letters, except for SC and DP, the first letter represents the owner info (not relevant to this contest), the second letter represents the fuel type, e.g.: B - Biomass; G - Gas; H - Hydro; S - PV; W - Wind; C - Coal; E - Geothermal; N - Nuclear; SC - Synchronous Condenser; R - Renewable (not differentiate wind or PV); P - Pump Storage; D - Demand Response; DP - Distributed PV.
Responses to some other questions:
References
[1] J. E. Price and J. Goodin, "Reduced network modeling of WECC as a market design prototype," IEEE Power Energy Soc. Gen. Meet., 2011.
[2] H. Yuan, R. Sen biswas, J. Tan, Y. Zhang, "Developing a Reduced 240-Bus WECC Dynamic Model for Frequency Response Study of High Renewable Integration," 2020 T&D