CS302 Lecture notes -- Simulating Random Events
Event Generation
One of the trickiest parts of writing a simulator is choosing how you generate random events. Suppose I say that the average transaction time is 10 minutes. The following sequence of transactions fits this description:
8 12 10 11 9 7 13
As does this sequence:
0 0 0 0 0 0 0 0 0 100
These two sequences are greatly different, even though they both average to ten.
Analyzing numerical sequences is a big area in statistics, and there is quite a bit of math involved, almost all of which is beyond the scope of this lab. However, some statistical terms and concepts will be useful.
Random numbers are defined to fit what are known as distributions. These define how we can characterize the random numbers in more ways than simply a mean value. We will use two such distributions in our simulation. The first is a very simple distribution called a uniform distribution. For our purposes, if we choose a random number r according to a uniform distribution with a mean m, this means that r will have a value between 0 and 2m, and that every value between 0 and 2m is equally likely.
For example, suppose that our random numbers are integers. If we are choosing random numbers according to a uniform distribution with mean 3, then each time we choose a random number, it is equally likely that this number will be 0, 1, 2, 3, 4, 5, and 6.
Uniform distributions are very easy to use in C. There are two important functions as part of the C standard library: srand48() and drand48(). srand48(i) takes an integer i and uses it as a seed to the random number generator. Then each time you call drand48() it returns a double uniformly distributed in the range [0, 1).
Thus, it is a random number that follows a uniform distribution with a mean of 0.5.
Therefore, if you want to get a random number according to a uniform distribution with a mean of m, you simply call drand48() and multiply the result by 2m:
    /* generate 20 random numbers using a uniform distribution with a mean
       of 50 */
    srand48(737);   // provide an initial "seed" to the random generator
    for (i = 0; i < 20; i++) {
      d = drand48()*mean*2;
      printf("%d \t %lf \n", i, d);
    }
A complete program to generate random numbers according to a uniform distribution is here: uniform.cpp.
We can view distribution functions using histograms. For example the following histogram shows a uniform distribution function whose mean is 5:
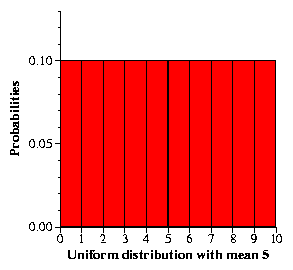 You can read this in the following way: If you choose a random value, the probability of it being between 0 and 1 is 0.1. Similarly, the probability of it being between 1 and 2 is 0.1. Etc.
Different distribution functions have diffierent histograms. A very important distribution function is the exponential distribution function. This distribution function has one parameter called lambda which is one over the mean of the distribution function.
Here is a histogram of an exponential whose mean is 120:
 Now, this is awfully hard to make any sense of. If we instead plot the histogram on a log axis, it looks a little more palatable.
 Cool, no? Now, the exponential is very important, because many real-life phenomena follow an exponential distribution. For example, light bulbs fail according to an exponential distribution. Moreover, most queueing situations (i.e. people entering a bank, cars arriving at a stop light) follow exponential distributions.
In our simulation, we are going to assume that transaction times (i.e. how long transactions take) follow a uniform distribution and the arrival times of customers follow an exponential distribution.
Implementing Histogram Distributions
Unfortunately, there currently are no standard implementations in C++ that
allow us to generate numbers from an arbitrary distributions. But, there is a
fairly straightforward way that we can implement our own random number generator
based on histograms. This approach will work for any histogram distribution
we define, which means that we now have an implementation for generating a random
number from any arbitrary distribution.
Here's the general idea of how it works. What we want to do is to
come up with a mapping from a uniform
distribution to our arbitrary distribution. Bigger "chunks" of the uniform
distribution will map to values that are more likely to occur in our
arbitrary distribution, like we see in the following figure:
 Our detailed approach is as follows. We assume we've already created
a file that gives us
a histogram of our arbitrary distribution. An example histogram file that gives
the exponential with a mean of 120 is in expon_120.
In this file, each line gives an x and y value. The x
value is the middle of a histogram bar, and the y value is the height of
the bar. The y values are relative frequences. In other words,
they do not have to sum to one. For example, here is a histogram file for the
uniform distribution with a mean of 1:
Our detailed approach is as follows. We assume we've already created
a file that gives us
a histogram of our arbitrary distribution. An example histogram file that gives
the exponential with a mean of 120 is in expon_120.
In this file, each line gives an x and y value. The x
value is the middle of a histogram bar, and the y value is the height of
the bar. The y values are relative frequences. In other words,
they do not have to sum to one. For example, here is a histogram file for the
uniform distribution with a mean of 1:
0  1
1  1
2  1
In other words, each value between 0 and 2 is equally likely.
Algorithm to set up histogram random number generator:
Based on the above, we set up our histogram random number generator as follows:
- Create a balanced binary tree (e.g., using the STL map container class)
- Set total to 0.
- Do the following for each line of the histogram file:
- Get the x and y value
- Set total to total + y
- Insert a record with key equal to total and value equal to x into the balanced binary tree
Algorithm to generate next histogram random number:
Whenever we need a new random number generated according to this histogram
distribution, we do the following:
- Generate a random number from a uniform distribution in the range [0,total).
- Find the node in our balanced binary tree whose key is the next greater value
(i.e. greater than our random number).
- Return the value of this node as the random number from the original
histogram distribution.
That's it!!