city-1.txt
0 0 1.3 1 9 12 0 1 1.0 1 3 4 |
 |
UNIX> sh /home/jplank/cs302/Labs/Lab8/start_lab.shThen write src/city_map.cpp. The makefile will compile.
| Street Avenue X Y Green-Street Green-Avenue |
Street and Avenue are integers. The rest are doubles. The units of X and Y are miles, and the units of Green-Street and Green-Avenue are seconds.
Intersections may be specified in any order.
So, here are some example cities:
city-1.txt
0 0 1.3 1 9 12 0 1 1.0 1 3 4 |
|
Since light [0,0]'s coordinates are (1.3,1) and light [0,1]'s coordinates are (1,1), the distance between the two lights is 0.3 miles. Note that since 0 is a multiple of five, Street zero and Avenue zero are two-way. Moreover, since Avenue one is the highest avenue, it is two-way.
city-2.txt
1 0 1.3 1.4 9 12 1 1 1 1.4 11 7 2 0 1.3 1.8 9 12 1 2 0.7 1.4 3 3 0 1 1 1 3 3 2 1 1 2.2 15 7 2 2 0.7 2.2 6 15 0 2 0.7 1 3 3 0 0 1.3 1 9 12 |
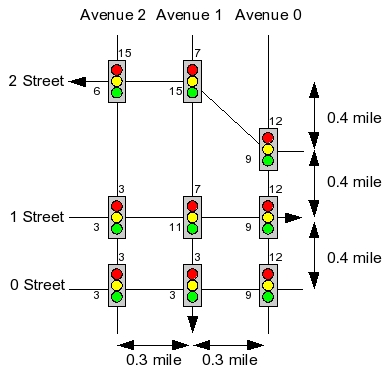 |
Now, Streets 1 and 2 are one-way, as is Avenue 1. The distances between intersections are straightforward, with the exception of [2,0] and [2,1]. That segment has a distance of 0.5, since sqrt(0.32+0.42) equals five.
Note also that the intersections are specified in a more random order here.
city-3.txt
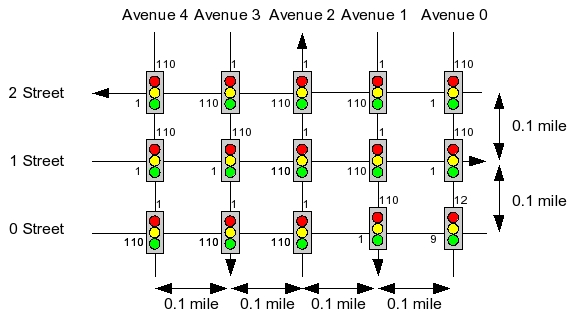
0 0 0.5 0.1 9 12 0 1 0.4 0.1 1 110 0 2 0.3 0.1 110 1 0 3 0.2 0.1 110 1 0 4 0.1 0.1 110 1 1 0 0.5 0.2 1 110 1 1 0.4 0.2 110 1 1 2 0.3 0.2 110 1 1 3 0.2 0.2 1 110 1 4 0.1 0.2 1 110 2 0 0.5 0.3 1 110 2 1 0.4 0.3 110 1 2 2 0.3 0.3 110 1 2 3 0.2 0.3 110 1 2 4 0.1 0.3 1 110 |
 |
| usage: city_map none|best|worst|avg time|print|jgraph - map on standard input |
In other words, there are two command line arguments. The first has one of four values:
The second command line has one of three values:
UNIX> bin/city_map none print < city-1.txt
      0 : Intersection:    0    0 -     1.300000     1.000000 -     9.000000    12.000000
      1 :    Segment to    0    1       Distance     0.300000
      2 : Intersection:    0    1 -     1.000000     1.000000 -     3.000000     4.000000
      3 :    Segment to    0    0       Distance     0.300000
UNIX> bin/city_map none print < city-2.txt
      0 : Intersection:    1    0 -     1.300000     1.400000 -     9.000000    12.000000
      1 :    Segment to    2    0       Distance     0.400000
      1 :    Segment to    0    0       Distance     0.400000
      2 : Intersection:    1    1 -     1.000000     1.400000 -    11.000000     7.000000
      3 :    Segment to    1    0       Distance     0.300000
      3 :    Segment to    0    1       Distance     0.400000
      4 : Intersection:    2    0 -     1.300000     1.800000 -     9.000000    12.000000
      5 :    Segment to    2    1       Distance     0.500000
      5 :    Segment to    1    0       Distance     0.400000
      6 : Intersection:    1    2 -     0.700000     1.400000 -     3.000000     3.000000
      7 :    Segment to    1    1       Distance     0.300000
      7 :    Segment to    2    2       Distance     0.800000
      7 :    Segment to    0    2       Distance     0.400000
      8 : Intersection:    0    1 -     1.000000     1.000000 -     3.000000     3.000000
      9 :    Segment to    0    2       Distance     0.300000
      9 :    Segment to    0    0       Distance     0.300000
     10 : Intersection:    2    1 -     1.000000     2.200000 -    15.000000     7.000000
     11 :    Segment to    2    2       Distance     0.300000
     11 :    Segment to    1    1       Distance     0.800000
     12 : Intersection:    2    2 -     0.700000     2.200000 -     6.000000    15.000000
     13 :    Segment to    1    2       Distance     0.800000
     14 : Intersection:    0    2 -     0.700000     1.000000 -     3.000000     3.000000
     15 :    Segment to    0    1       Distance     0.300000
     15 :    Segment to    1    2       Distance     0.400000
     16 : Intersection:    0    0 -     1.300000     1.000000 -     9.000000    12.000000
     17 :    Segment to    0    1       Distance     0.300000
     17 :    Segment to    1    0       Distance     0.400000
UNIX>
Now, let's try some shortest path calculations:
UNIX> bin/city_map best time < city-1.txt
36
UNIX> bin/city_map worst time < city-1.txt
40
UNIX> bin/city_map avg time < city-1.txt
37.1429
UNIX>
The distance between the two lights in city-1.txt is 0.3 miles, which takes 36 seconds at 30 MPH: 0.3 / 30 * 3600 = 36. Therefore the best time is 36 seconds. The worst time adds four seconds because in the worst case, you arrive at the light as it turns green for Avenue 1. You wait four seconds before the light turns green for you again. The average case adds 1.1429 seconds to the best case. This is because 3/7 of the time, the light is green. The other 4/7 of the time, the light is red for an average of 2 seconds. Thus, your expected wait time is 0*(3/7) + 2*(4/7) = 8/7 = 1.1429 seconds. Note, that is also equal to the equation I gave: 42/(2(3+4)) = 8/7.
We print the paths below:
UNIX> bin/city_map best print < city-1.txt
      0 : Intersection:    0    0 -     1.300000     1.000000 -     9.000000    12.000000
      1 :    Segment to    0    1       Distance     0.300000
      2 : Intersection:    0    1 -     1.000000     1.000000 -     3.000000     4.000000
      3 :    Segment to    0    0       Distance     0.300000
      4 : PATH: [0000,0000] -> [0000,0001] - Time:    36.000000
UNIX> bin/city_map worst print < city-1.txt | grep PATH
      4 : PATH: [0000,0000] -> [0000,0001] - Time:    40.000000
UNIX> bin/city_map avg print < city-1.txt | grep PATH
      4 : PATH: [0000,0000] -> [0000,0001] - Time:    37.142857
UNIX>
Let's look at the paths in
city-2.txt:
UNIX> bin/city_map best print < city-2.txt | grep PATH
     18 : PATH: [0000,0000] -> [0001,0000] - Time:    48.000000
     19 : PATH: [0001,0000] -> [0002,0000] - Time:    96.000000
     20 : PATH: [0002,0000] -> [0002,0001] - Time:   156.000000
     21 : PATH: [0002,0001] -> [0002,0002] - Time:   192.000000
UNIX> bin/city_map worst print < city-2.txt | grep PATH
     18 : PATH: [0000,0000] -> [0000,0001] - Time:    39.000000
     19 : PATH: [0000,0001] -> [0000,0002] - Time:    78.000000
     20 : PATH: [0000,0002] -> [0001,0002] - Time:   129.000000
     21 : PATH: [0001,0002] -> [0002,0002] - Time:   231.000000
UNIX> bin/city_map avg print < city-2.txt | grep PATH
     18 : PATH: [0000,0000] -> [0001,0000] - Time:    49.928571
     19 : PATH: [0001,0000] -> [0002,0000] - Time:    99.857143
     20 : PATH: [0002,0000] -> [0002,0001] - Time:   160.970779
     21 : PATH: [0002,0001] -> [0002,0002] - Time:   202.327922
UNIX>
Obviously, when all lights are green, the fastest path is the one going
from light [2,0] to [2,1], since that cuts distance. That path goes
(0.4 + 0.4 + 0.5 + 0.3) = 1.6 miles (192 seconds at 30MPH), while the
path that travels along Street 0 to Avenue 2 goes (0.3 + 0.3 + 0.4 + 0.8) =
1.8 miles (216 seconds).
When we wait the maximum time, we wait (9+9+7+15) = 40 seconds for lights, for a total of 232 seconds on the first path. On the second, we wait (3+3+3+6) = 15 seconds, for a total of 231. For that reason, the worst case path is the one that travels all the way down Street 0 first. The best average case uses the first path.
Finally, let's look at city-3.txt. Clearly, the best case path simply has the shortest number of edges, since all road segments are the same length:
UNIX> bin/city_map best print < city-3.txt | grep PATH
     30 : PATH: [0000,0000] -> [0001,0000] - Time:    12.000000
     31 : PATH: [0001,0000] -> [0002,0000] - Time:    24.000000
     32 : PATH: [0002,0000] -> [0002,0001] - Time:    36.000000
     33 : PATH: [0002,0001] -> [0002,0002] - Time:    48.000000
     34 : PATH: [0002,0002] -> [0002,0003] - Time:    60.000000
     35 : PATH: [0002,0003] -> [0002,0004] - Time:    72.000000
UNIX>
However, when we wait the maximum amount for each light, we see
that we can get through the graph in a circuitous fashion, waiting
a maximum of one second for each light. Even though this makes
us travel 1.4 miles (168 seconds) instead of 0.6 (72 seconds),
it is worth it because we
only wait 14 extra seconds for lights. The original path
makes us wait 115 seconds for a total of 187 seconds, making it
inferior to the path below:
UNIX> bin/city_map worst print < city-3.txt | grep PATH
     30 : PATH: [0000,0000] -> [0001,0000] - Time:    13.000000
     31 : PATH: [0001,0000] -> [0002,0000] - Time:    26.000000
     32 : PATH: [0002,0000] -> [0002,0001] - Time:    39.000000
     33 : PATH: [0002,0001] -> [0002,0002] - Time:    52.000000
     34 : PATH: [0002,0002] -> [0002,0003] - Time:    65.000000
     35 : PATH: [0002,0003] -> [0001,0003] - Time:    78.000000
     36 : PATH: [0001,0003] -> [0001,0002] - Time:    91.000000
     37 : PATH: [0001,0002] -> [0001,0001] - Time:   104.000000
     38 : PATH: [0001,0001] -> [0000,0001] - Time:   117.000000
     39 : PATH: [0000,0001] -> [0000,0002] - Time:   130.000000
     40 : PATH: [0000,0002] -> [0000,0003] - Time:   143.000000
     41 : PATH: [0000,0003] -> [0000,0004] - Time:   156.000000
     42 : PATH: [0000,0004] -> [0001,0004] - Time:   169.000000
     43 : PATH: [0001,0004] -> [0002,0004] - Time:   182.000000
UNIX>
The jgraph output is nice if you can plot postscript. Below, I've
converted the outputs to JPG files. For example:
UNIX> bin/city_map none jgraph < city-2.txt | jgraph -P > city-2-none.ps
UNIX> open city-2-none.ps
UNIX>
Then I convert the postscript to JPG using the Preview program on my Macintosh.
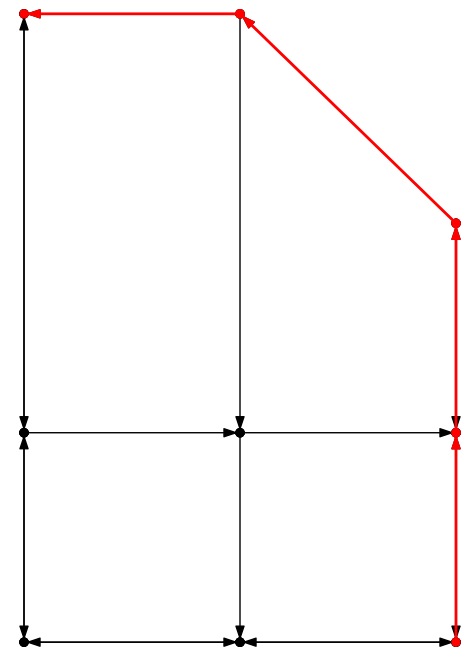
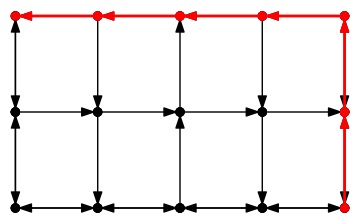
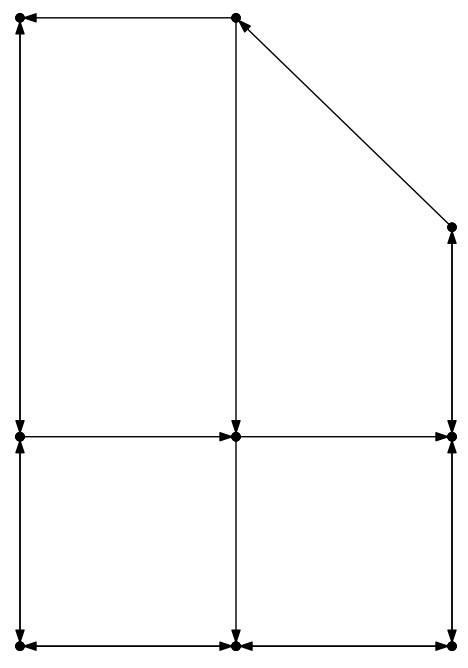 City-2: None |
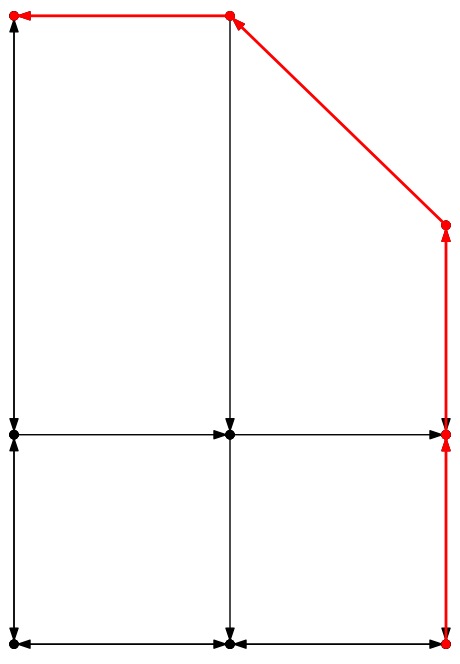 City-2: Best |
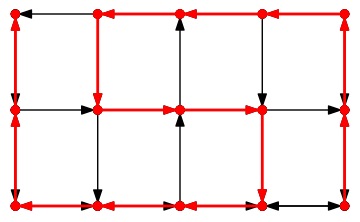
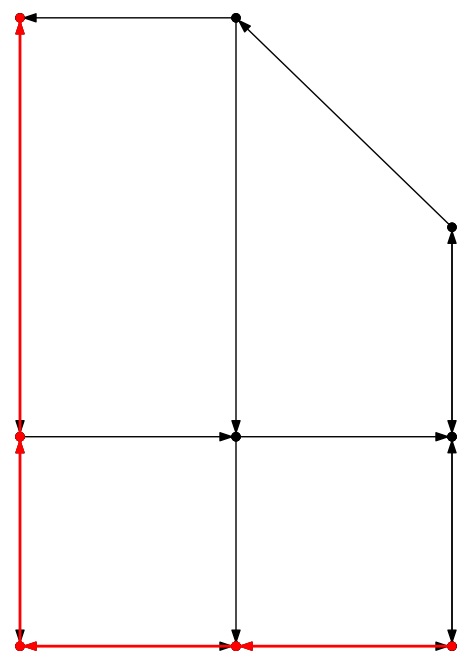 City-2: Worst |
 City-2: Avg |
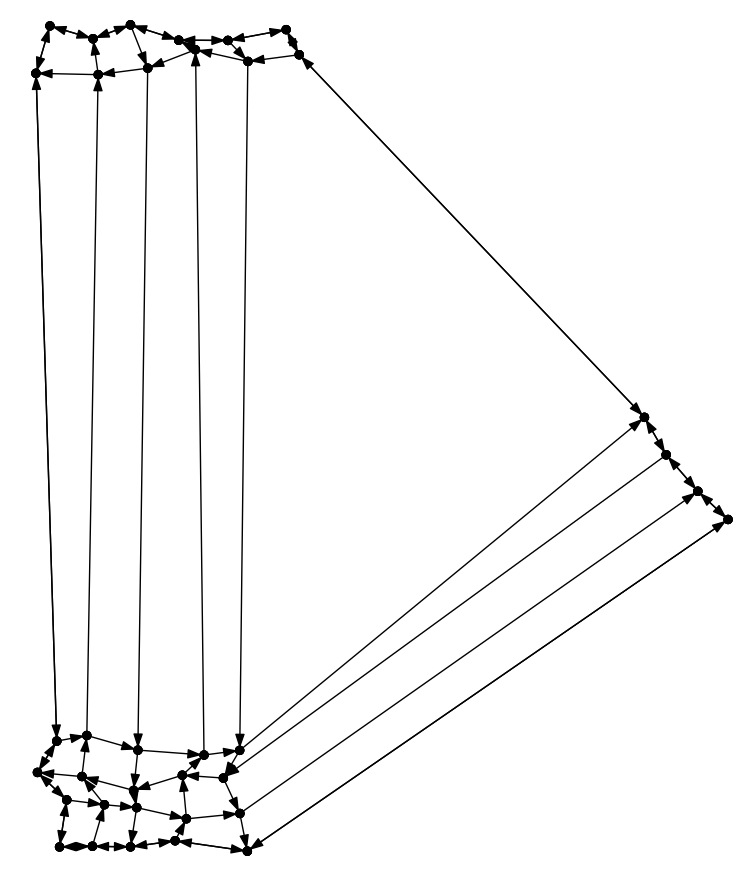
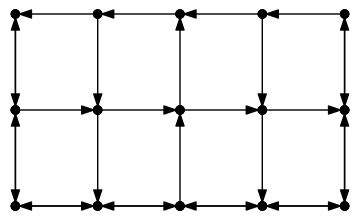 City-3: None |
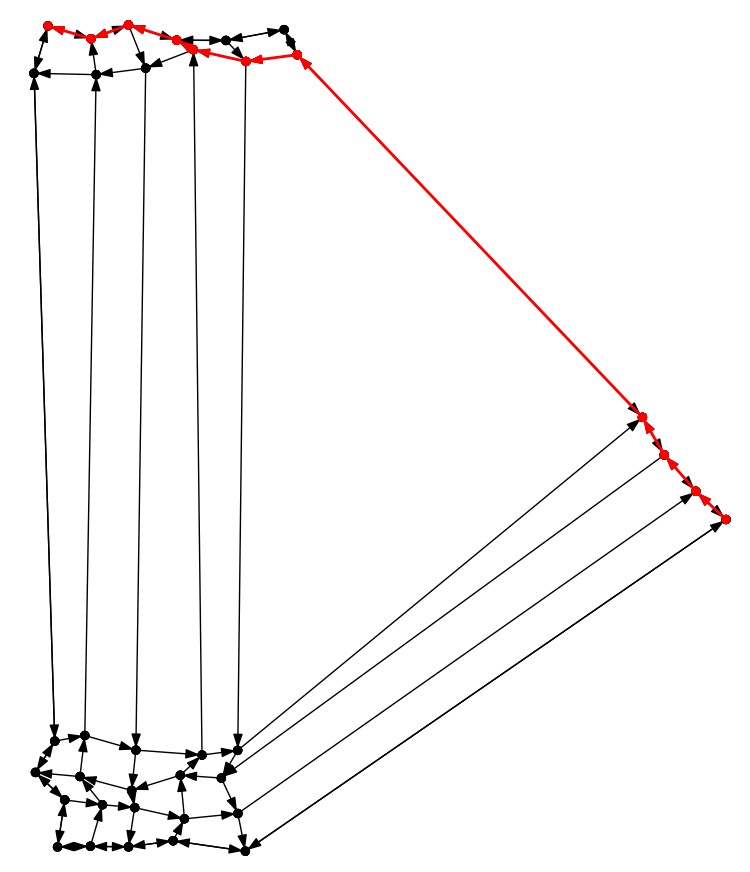
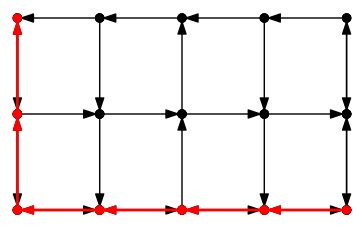 City-3: Best |
 City-3: Worst |
 City-3: Avg |
I have some more interesting and fun maps in the other city-x.txt files. You can click on the links for uncompressed jpg images.
 City-4: None |
 City-4: Best |
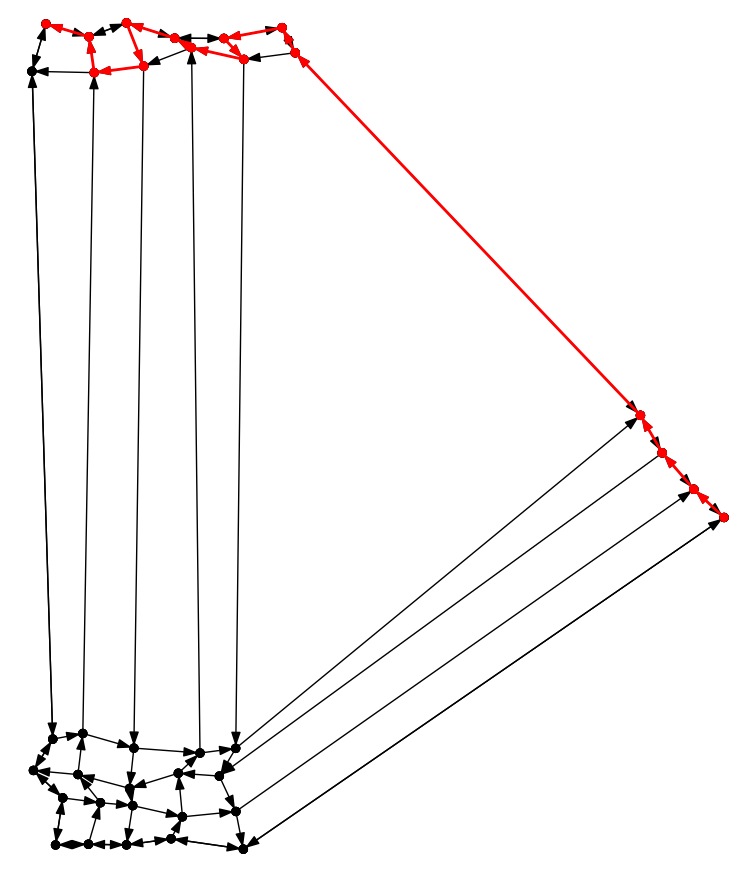 City-4: Worst |
 City-5: Best |
 City-5: Worst |
 City-5: Avg |
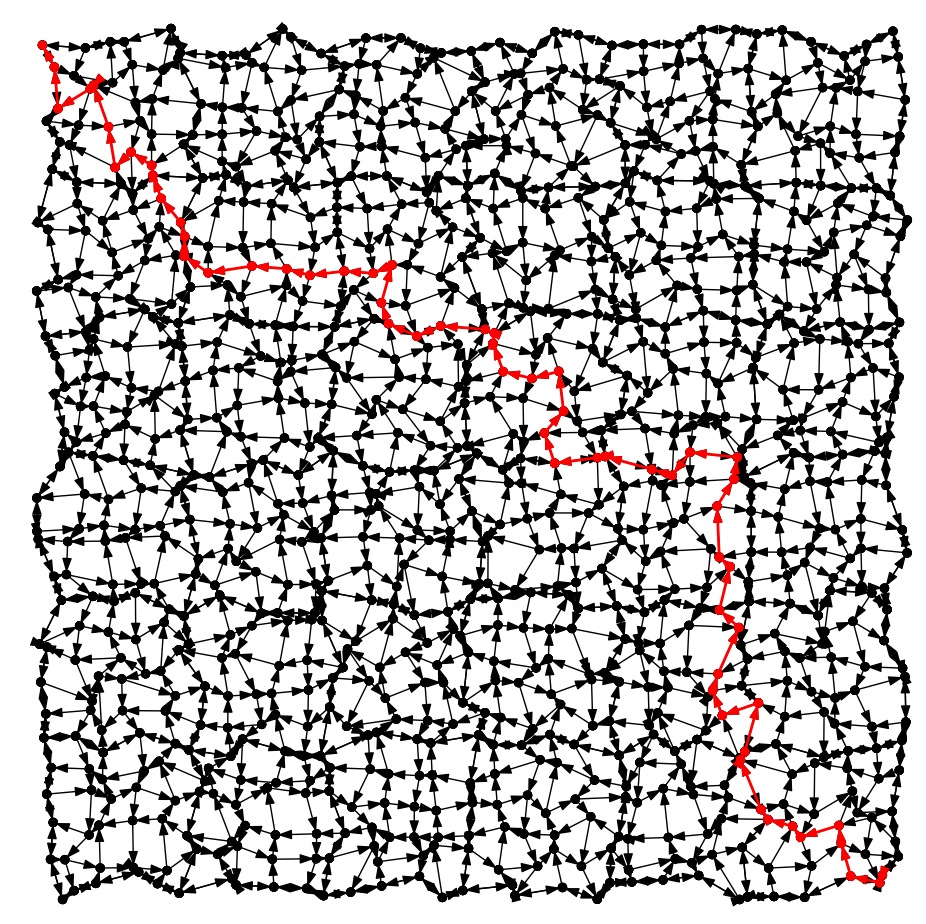
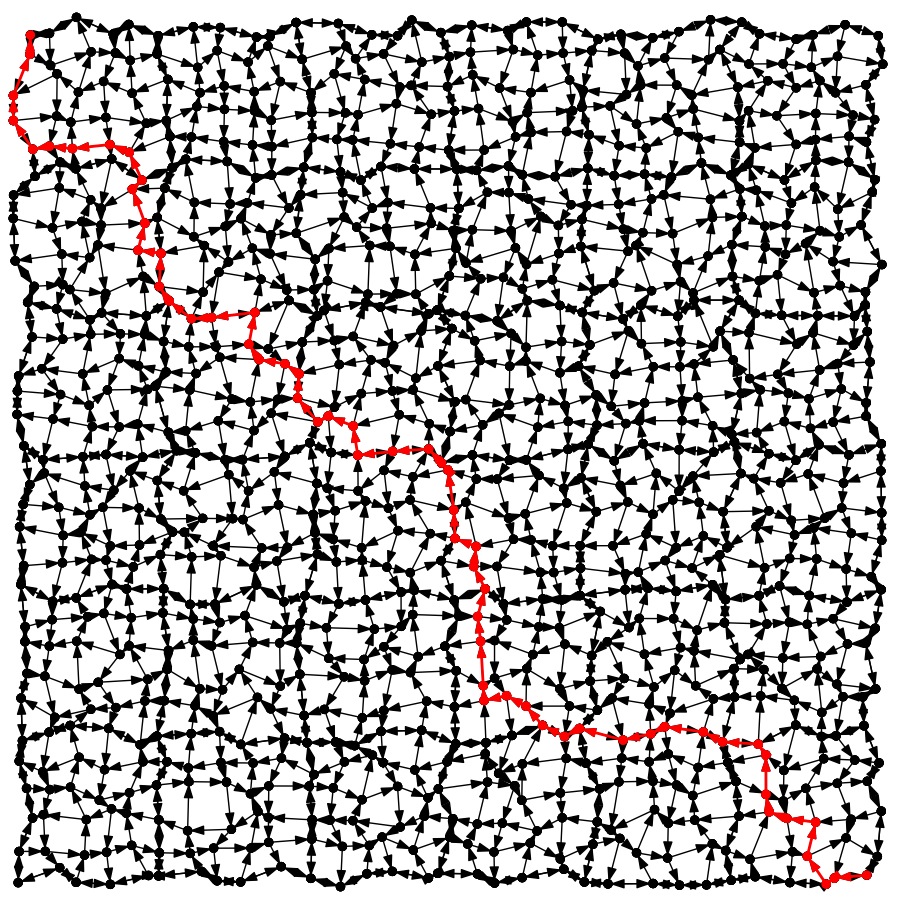 City-6: Best |
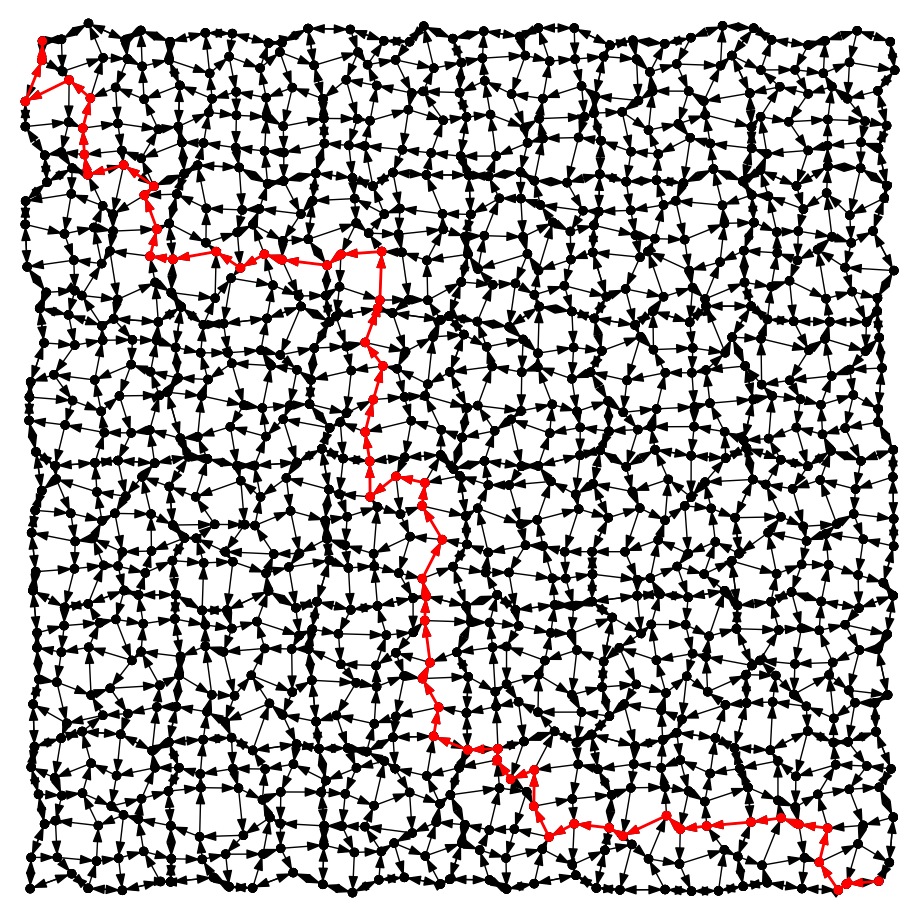 City-6: Worst |
 City-6: Avg |
Don't try to view pictures of city-7.txt. It's too big.
UNIX> bin/city_map none print < city-7.txt | tail -n 1
 502001 :    Segment to  499  500       Distance     0.458654
UNIX> bin/city_map best print < city-7.txt | grep PATH | wc
    1000    9000   64000
UNIX> time bin/city_map best print < city-7.txt > /dev/null
6.684u 0.120s 0:06.82 99.7%     0+0k 0+0io 0pf+0w
UNIX>
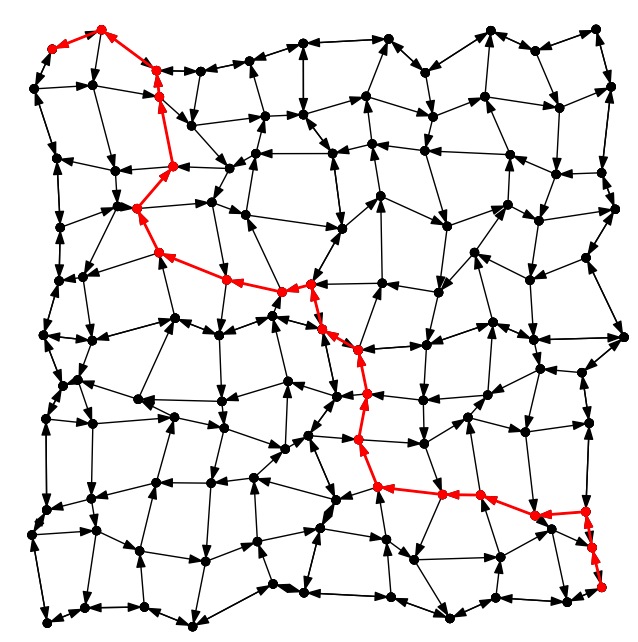
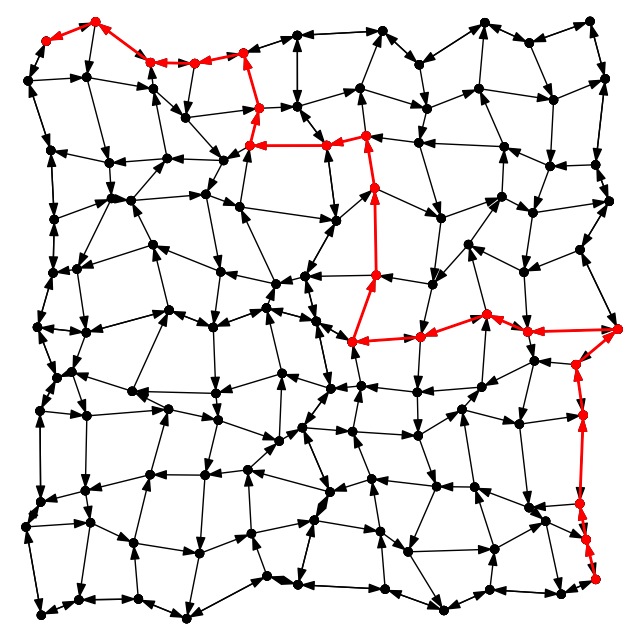
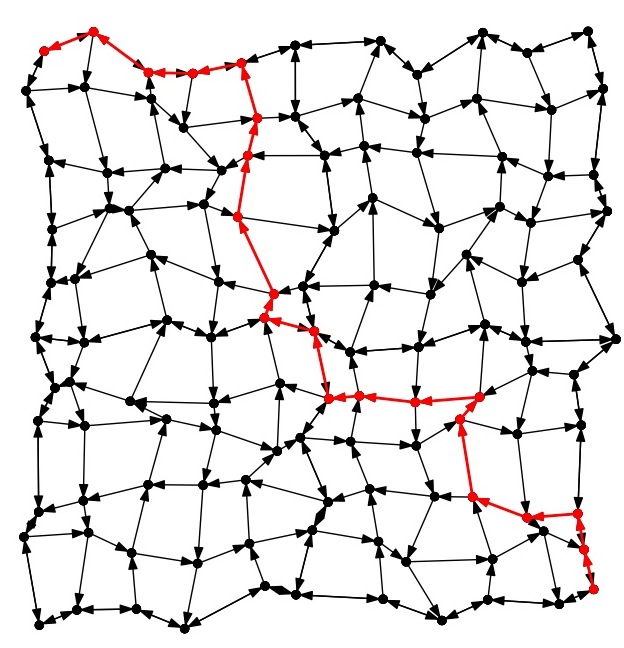
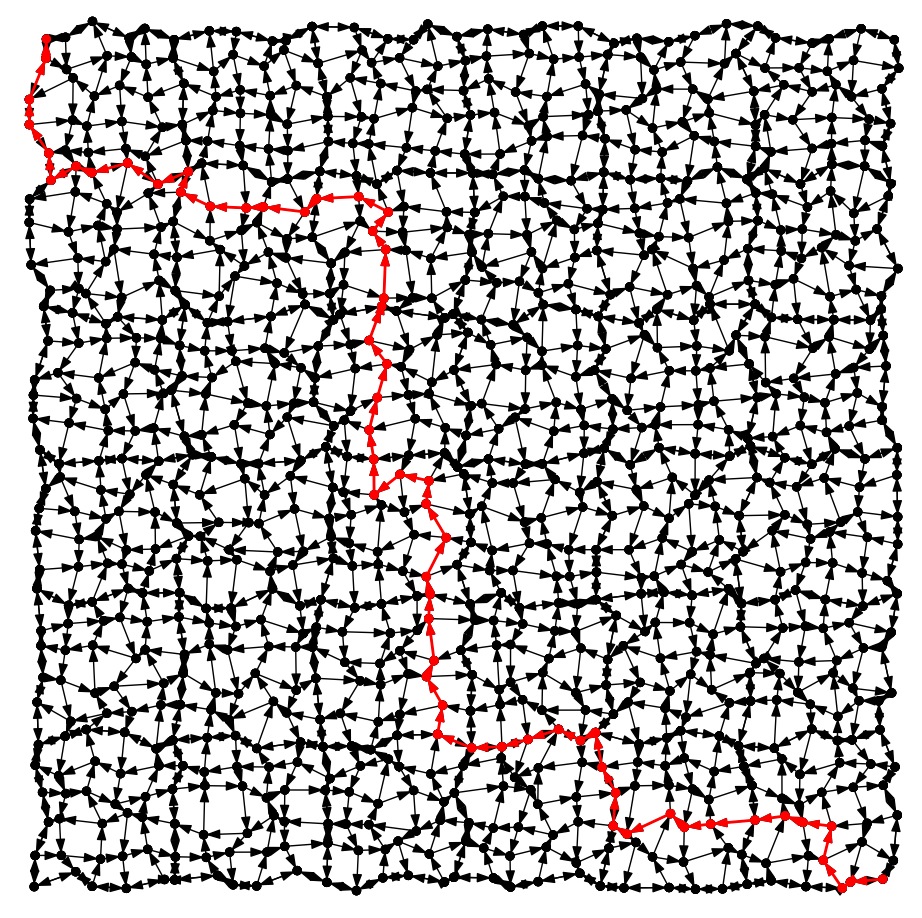
 City-8: Best |
 City-8: Worst |
 City-8: Avg |
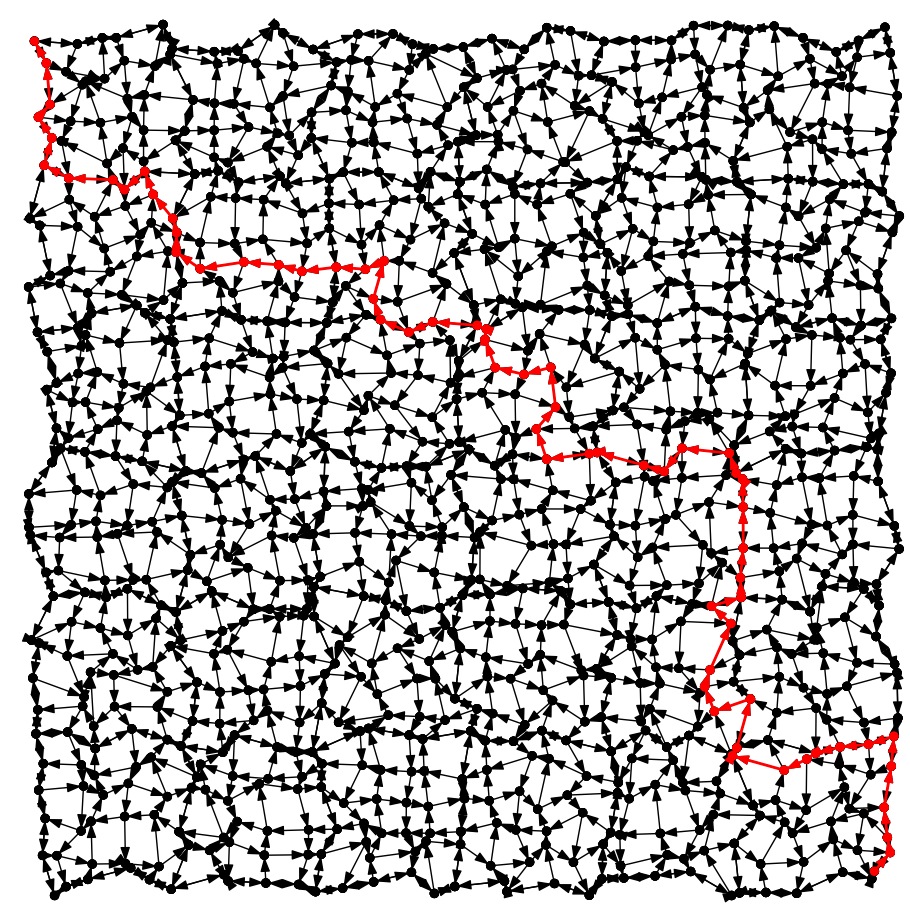
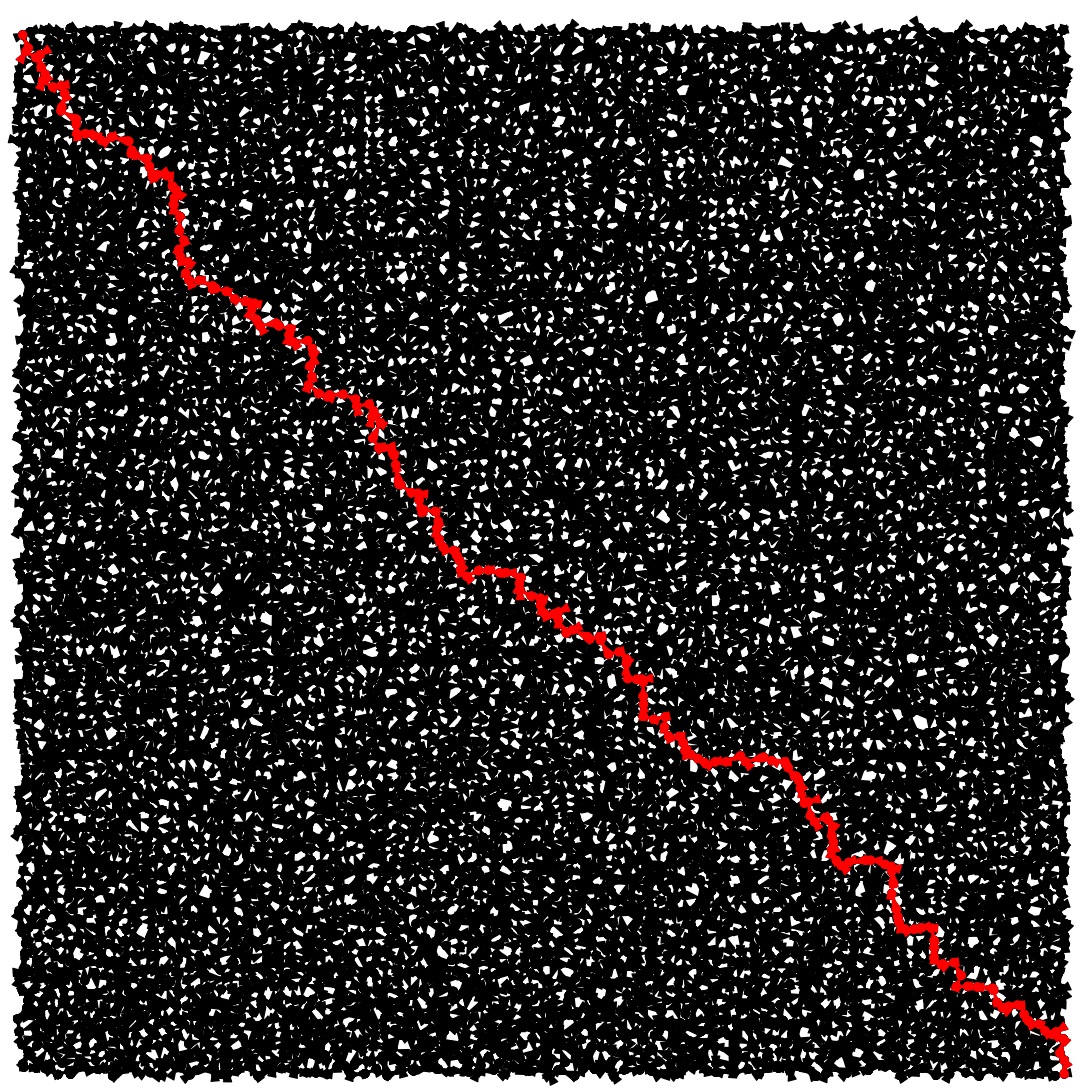 City-9: Best |
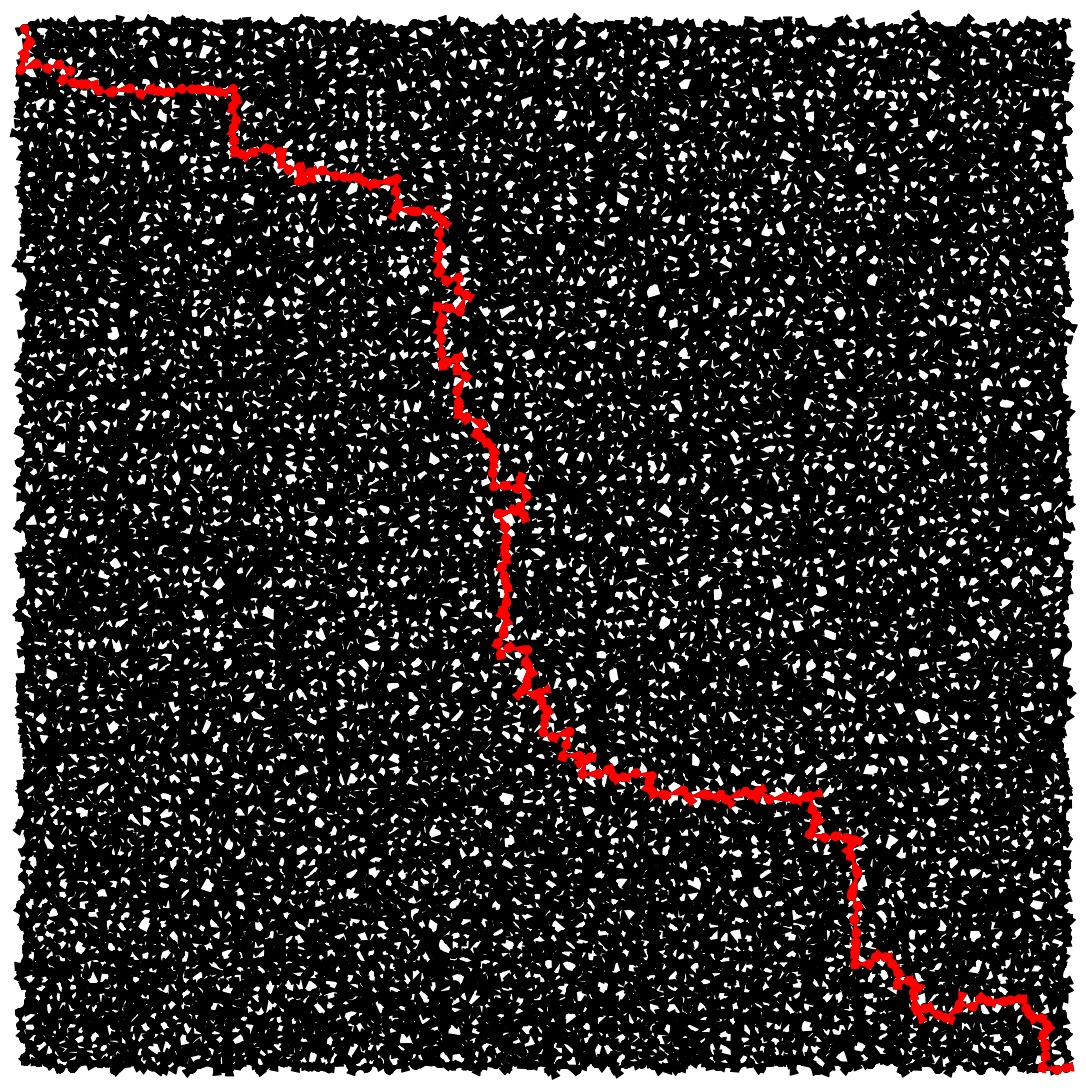 City-9: Worst |
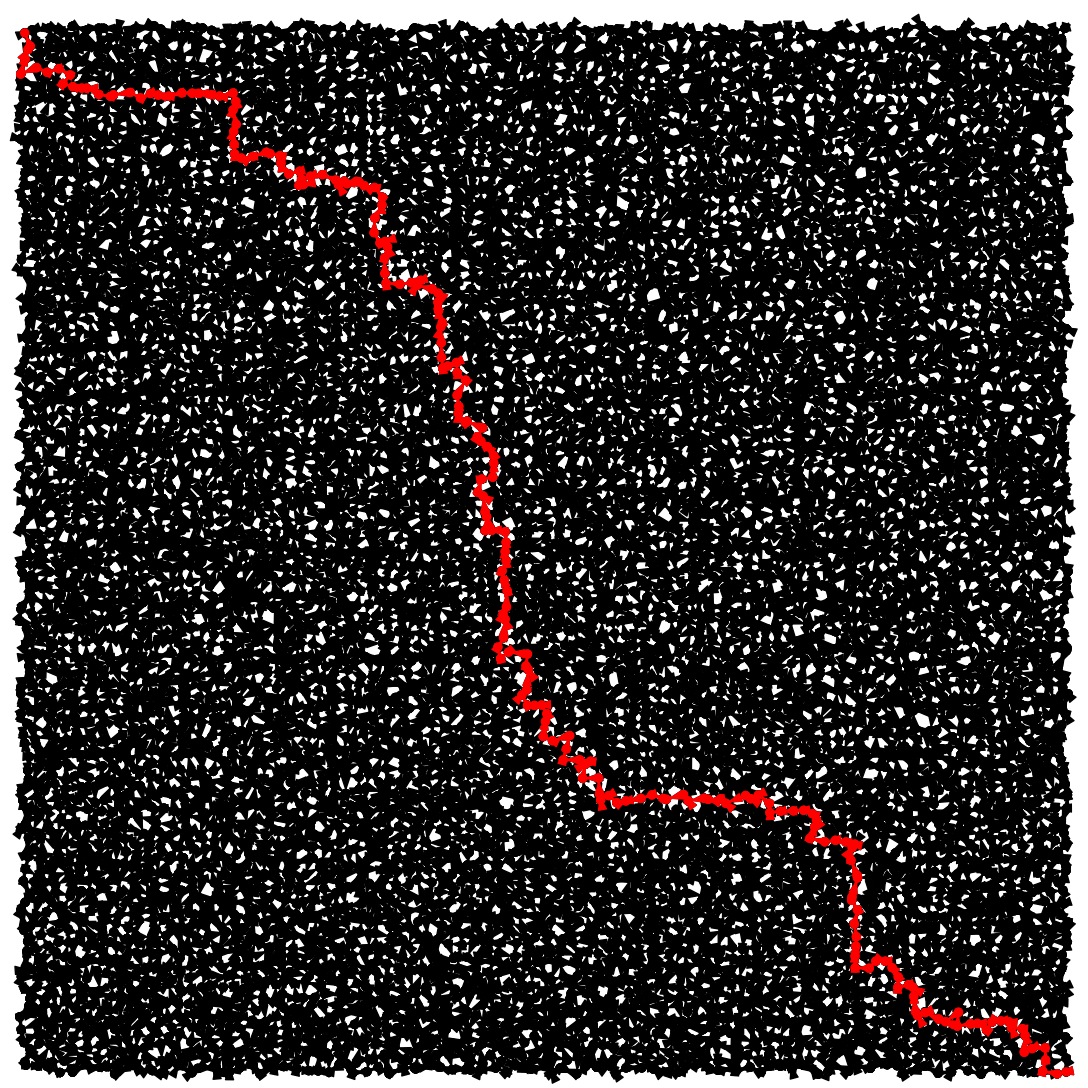 City-9: Avg |
To grade, I am going to pipe the output of your city_map with print to sort. It must match the output of my city_map piped to sort. All of the grading examples have unique light durations and edge lengths. Therefore, it should not be hard to make the two outputs match when piped to sort. Note that in city-3.txt, there are multiple best and avg paths -- that is because light durations and edge lengths are not unique. You do not have to match my output in this case -- you only have to match the outputs (after piping to sort) of the grading examples.
typedef enum { STREET, AVENUE } Road_Type;

class Intersection {
  public:
    int street;
    int avenue;
    double x;
    double y;
    double green[2];    // Light green times for STREET & AVENUE
    list <class Road_Segment *> adj;
    double best_time;
    class Road_Segment *backedge;
    multimap <double, Intersection *>::iterator bfsq_ptr;
};
|
The first five fields of an Intersection are the input values -- street number, avenue number, x coordinate, y coordinate, and green durations, indexed by Road_Type. Next is an adjacency list. For example, in city-2.txt, the adjacency list for [1,1] contains road segments to [1,0] and [0,1]. This is because street 1 and avenue 1 are both one-way. On the other hand, the adjacency list for [1,2] contains road segments to [0,2], [2,2] and [1,1].
I don't care about the order of your adjacency lists. They do not have to match mine. This is why I pipe the output of city_map to sort .
The best_time, backedge and bfsq_ptr fields are for you to use when you implement Dijkstra.
class Road_Segment {
   public:
     Road_Type type;
     int number;
     double distance;
     Intersection *from;
     Intersection *to;
};
|
Road_Segment instances represent edges. They should be completely straightforward. For example, in city-2.txt the Road_Segment values for the segment from [2,0] to [2,1] will have:
class City_Map {
  public:
    City_Map();
    void Print();
    void Spit_Jgraph();
    double Dijkstra(int avg_best_worst);   // 'A' for avg, 'B' for best, 'W' for worst
    Intersection *first;
    Intersection *last;
    list <Intersection *> all;
    multimap <double, Intersection *> bfsq;
    list <Road_Segment *> path;
};
|
Finally, the City_Map class has four methods -- the constructor and Dijkstra(), which you implement, and Print()/Spit_Jgraph(), which I have implemented.
Additionally, it has five variables. The first three you have to set up with your constructor:
Work incrementally on the constructor. First, write a pass that reads all of the lights, creates their Intersection classes and puts them onto all, without worrying about adjacency lists. You should then be able to run the program and have it print out the graph without edges.
Next, work on adding the edges and again print. This is a pain. I used a temporary two-dimensional vector of Intersections, which made it easy for me to get from one intersection to another, and set up the adjacencly lists. When I was done, I discarded the vector (actually, that was done automatically for me)..
When you're done with this, none and print should work. Then get busy on Dijkstra(). Frankly, I think writing Dijkstra() is easier than getting the adjacency lists set up.