CS360 Supplemental Midterm Exam -- April 5, 2012
Files
Comments
Overall a good job. The answers have detailed pictures to accompany the descriptions,
so check them out.
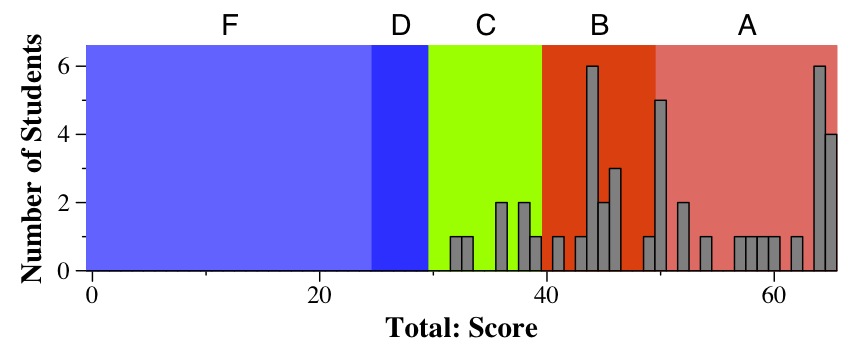
- A: 50 to 65
- B: 40 to 50
- C: 30 to 40
- D: 25 to 30
- F: Below 20
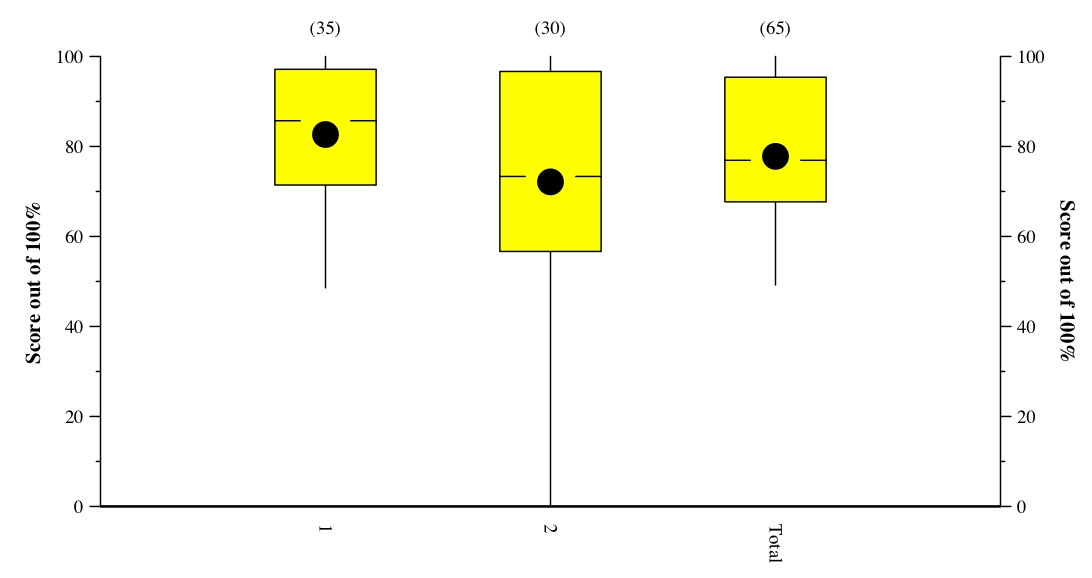
Tukey Plots
This is a Tukey Plot, which has lines to the max and min, yellow box denoting
the 1st and 3rd quartiles, hash marks at the median, and dot at the mean.