CS360 Midterm Exam #1 -- February 20, 2014
Files
Comments
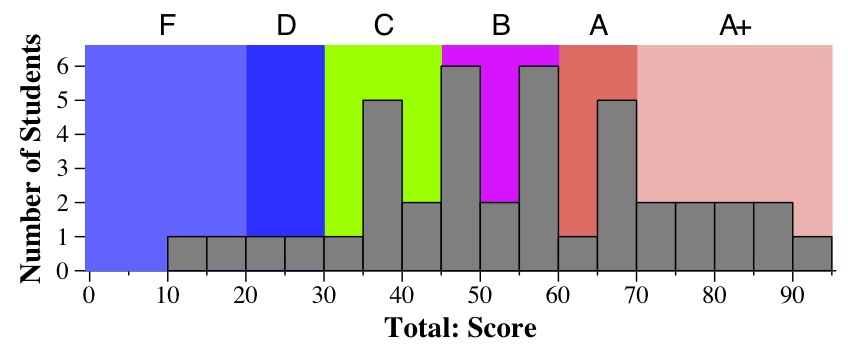
Ok, this was a hard exam. Of course, when I give an exam that is that hard,
I do some serious curving. Here is the mapping of scores to grades:
- A+: 70 to 96
- A: 60 to 70
- B: 45 to 60
- C: 30 to 45
- D: 20 to 30
- F: Below 20
Tukey Plots
This is a Tukey Plot, which has lines to the max and min, yellow box denoting
the 1st and 3rd quartiles, hash marks at the median, and dot at the mean.
In the "answers and grading", there are histograms of scores for each question.