CS360 Midterm Exam 1 -- February 21, 2017
Files
Comments
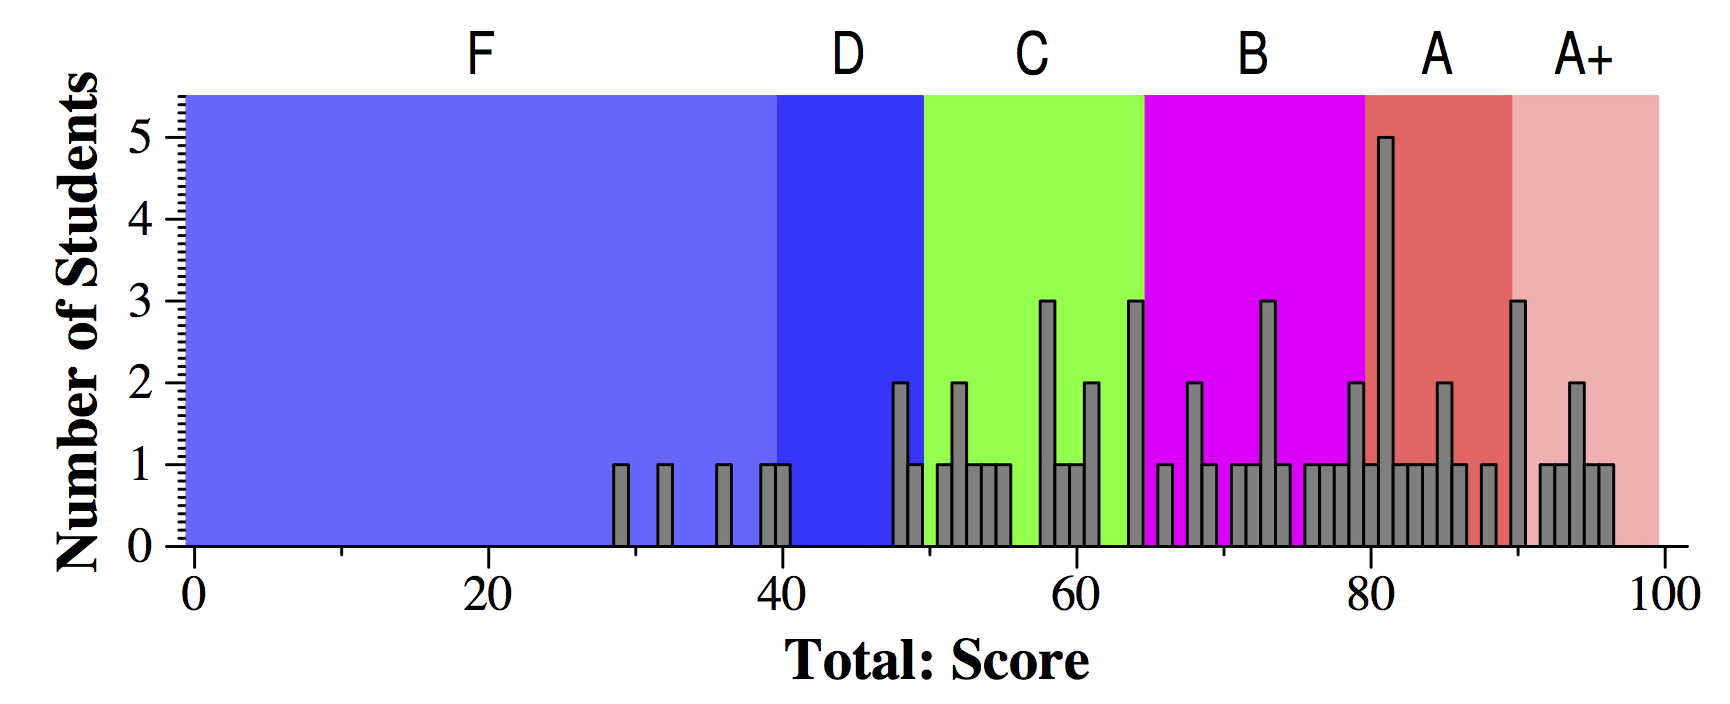
This was a pretty standard, difficult exam. I thought that by and large, the class did quite well!
- A+: 90 - 95 (You could get higher, because there were 5 points of Extra Credit on problem 3)
- A: 80 - 90
- B: 65 - 80
- C: 50 - 65
- D: 40 - 50
- F: 0 - 35
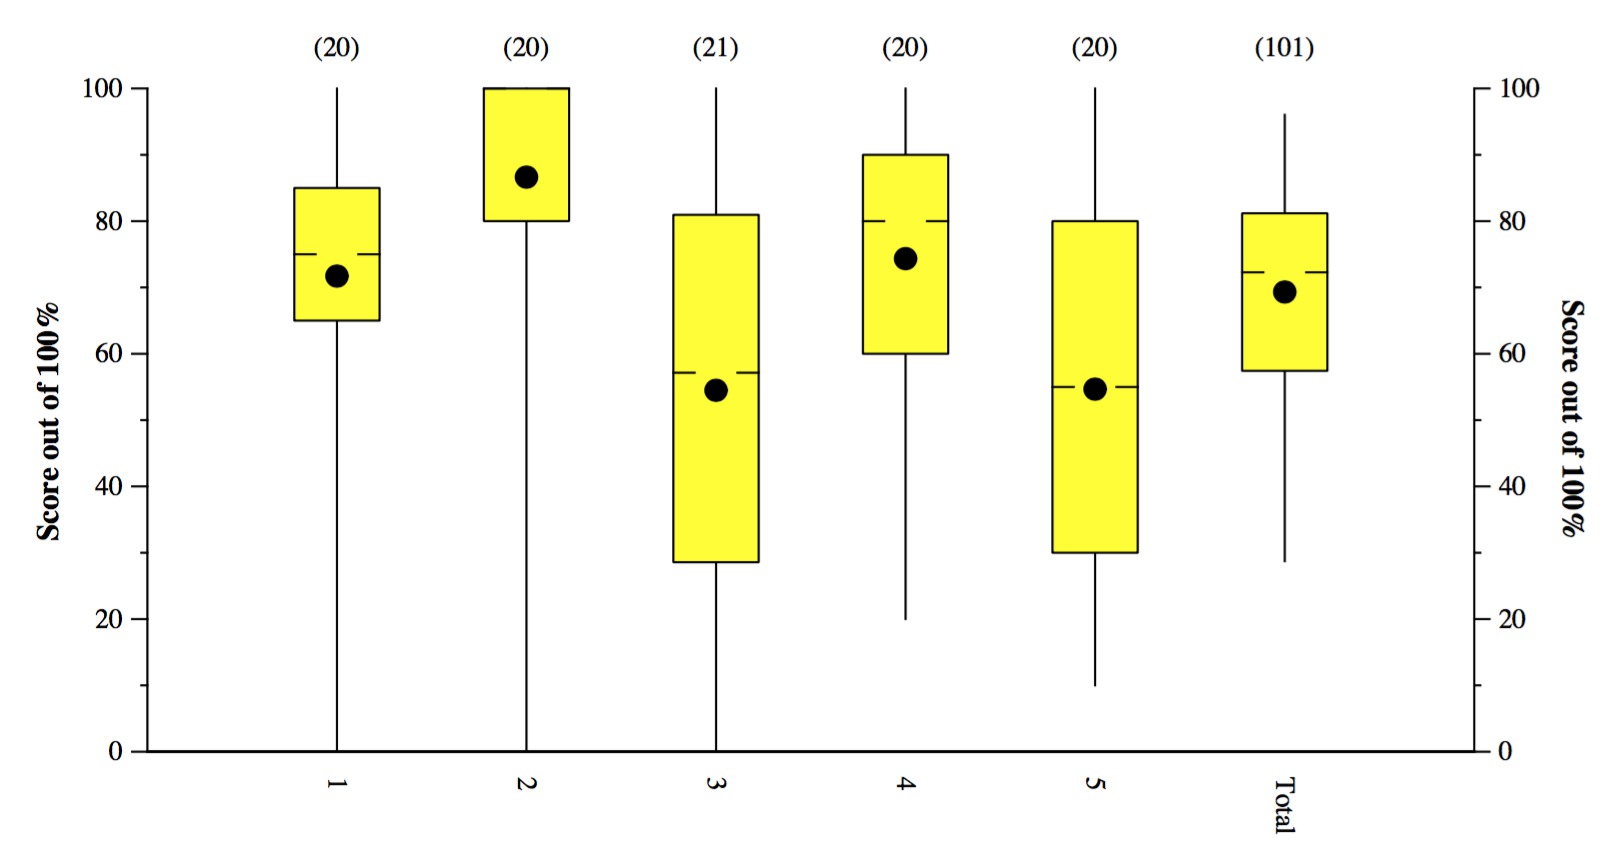
Tukey Plots
This is a Tukey Plot, which has lines to the max and min, yellow box denoting
the 1st and 3rd quartiles, hash marks at the median, and dot at the mean.
In the "answers and grading", there are histograms of scores for each question.