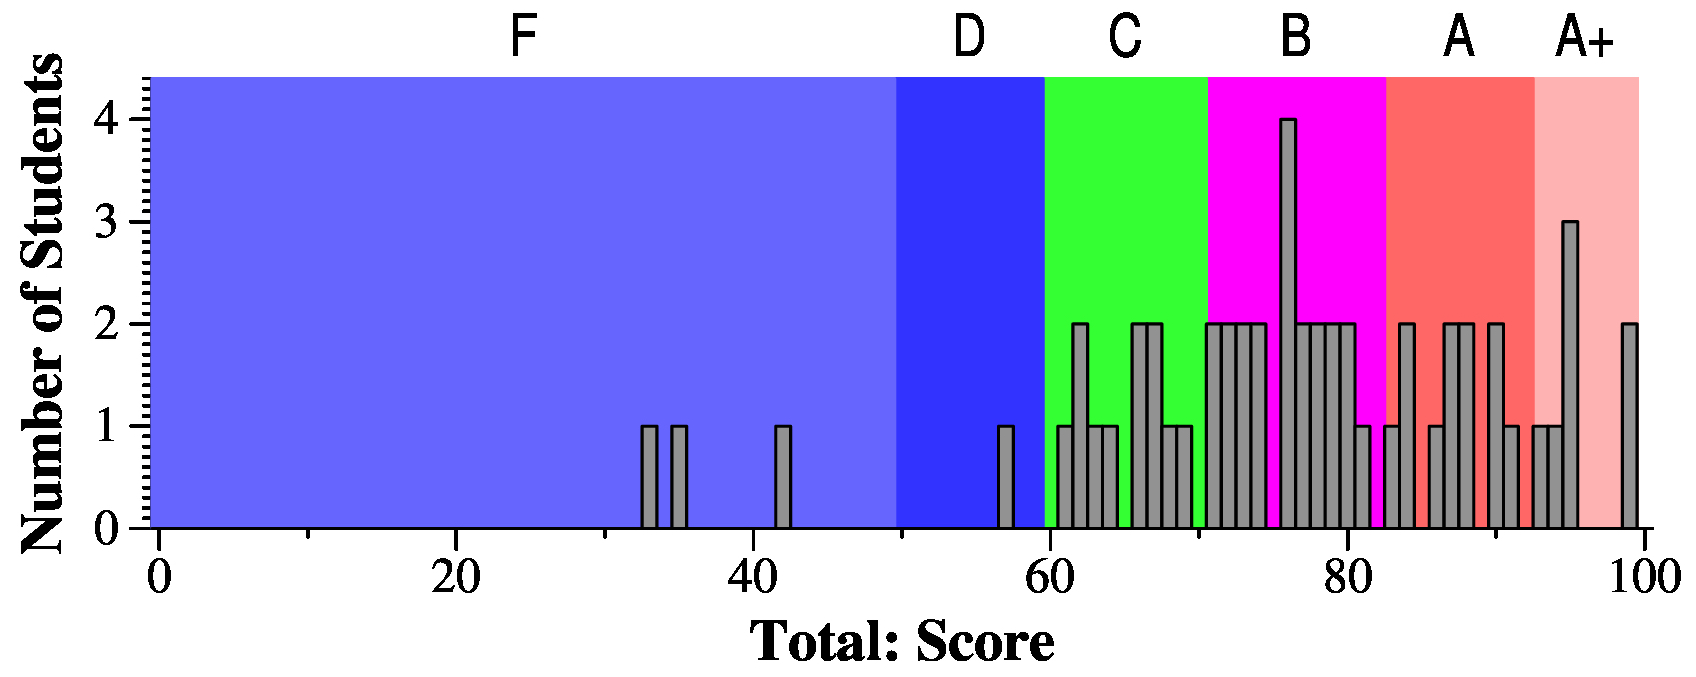
This is the best that a class has ever done on this midterm -- very well done!
A+: 93 - 100
A: 83 - 93
B: 71 - 83
C: 60 - 71
D: 50 - 60
F: 0 - 50
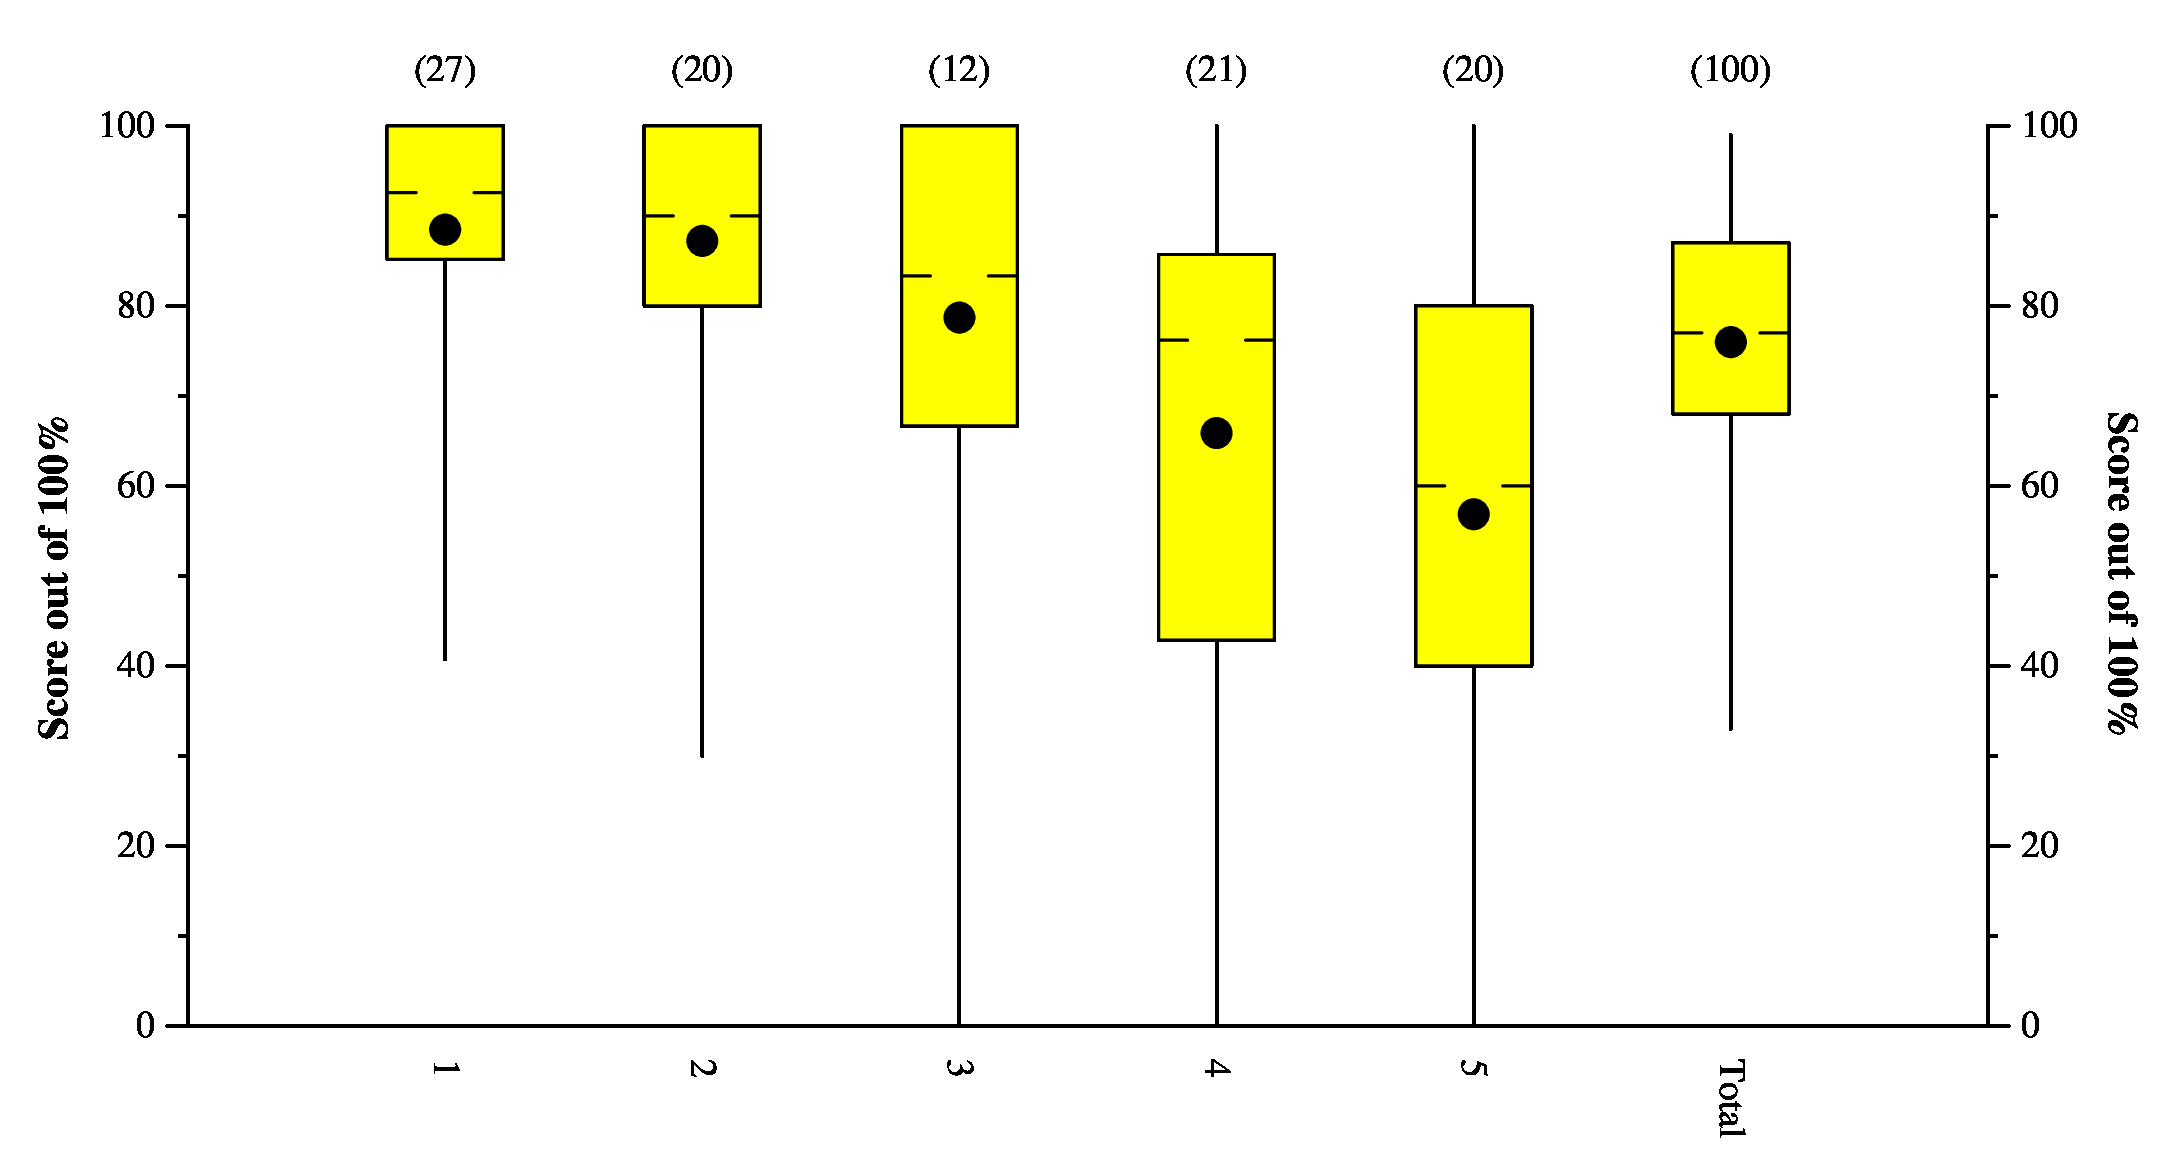
Tukey Plots
This is a Tukey Plot, which has lines to the max and min, yellow box denoting
the 1st and 3rd quartiles, hash marks at the median, and dot at the mean.