This was a straightforward exam, much like last year's.
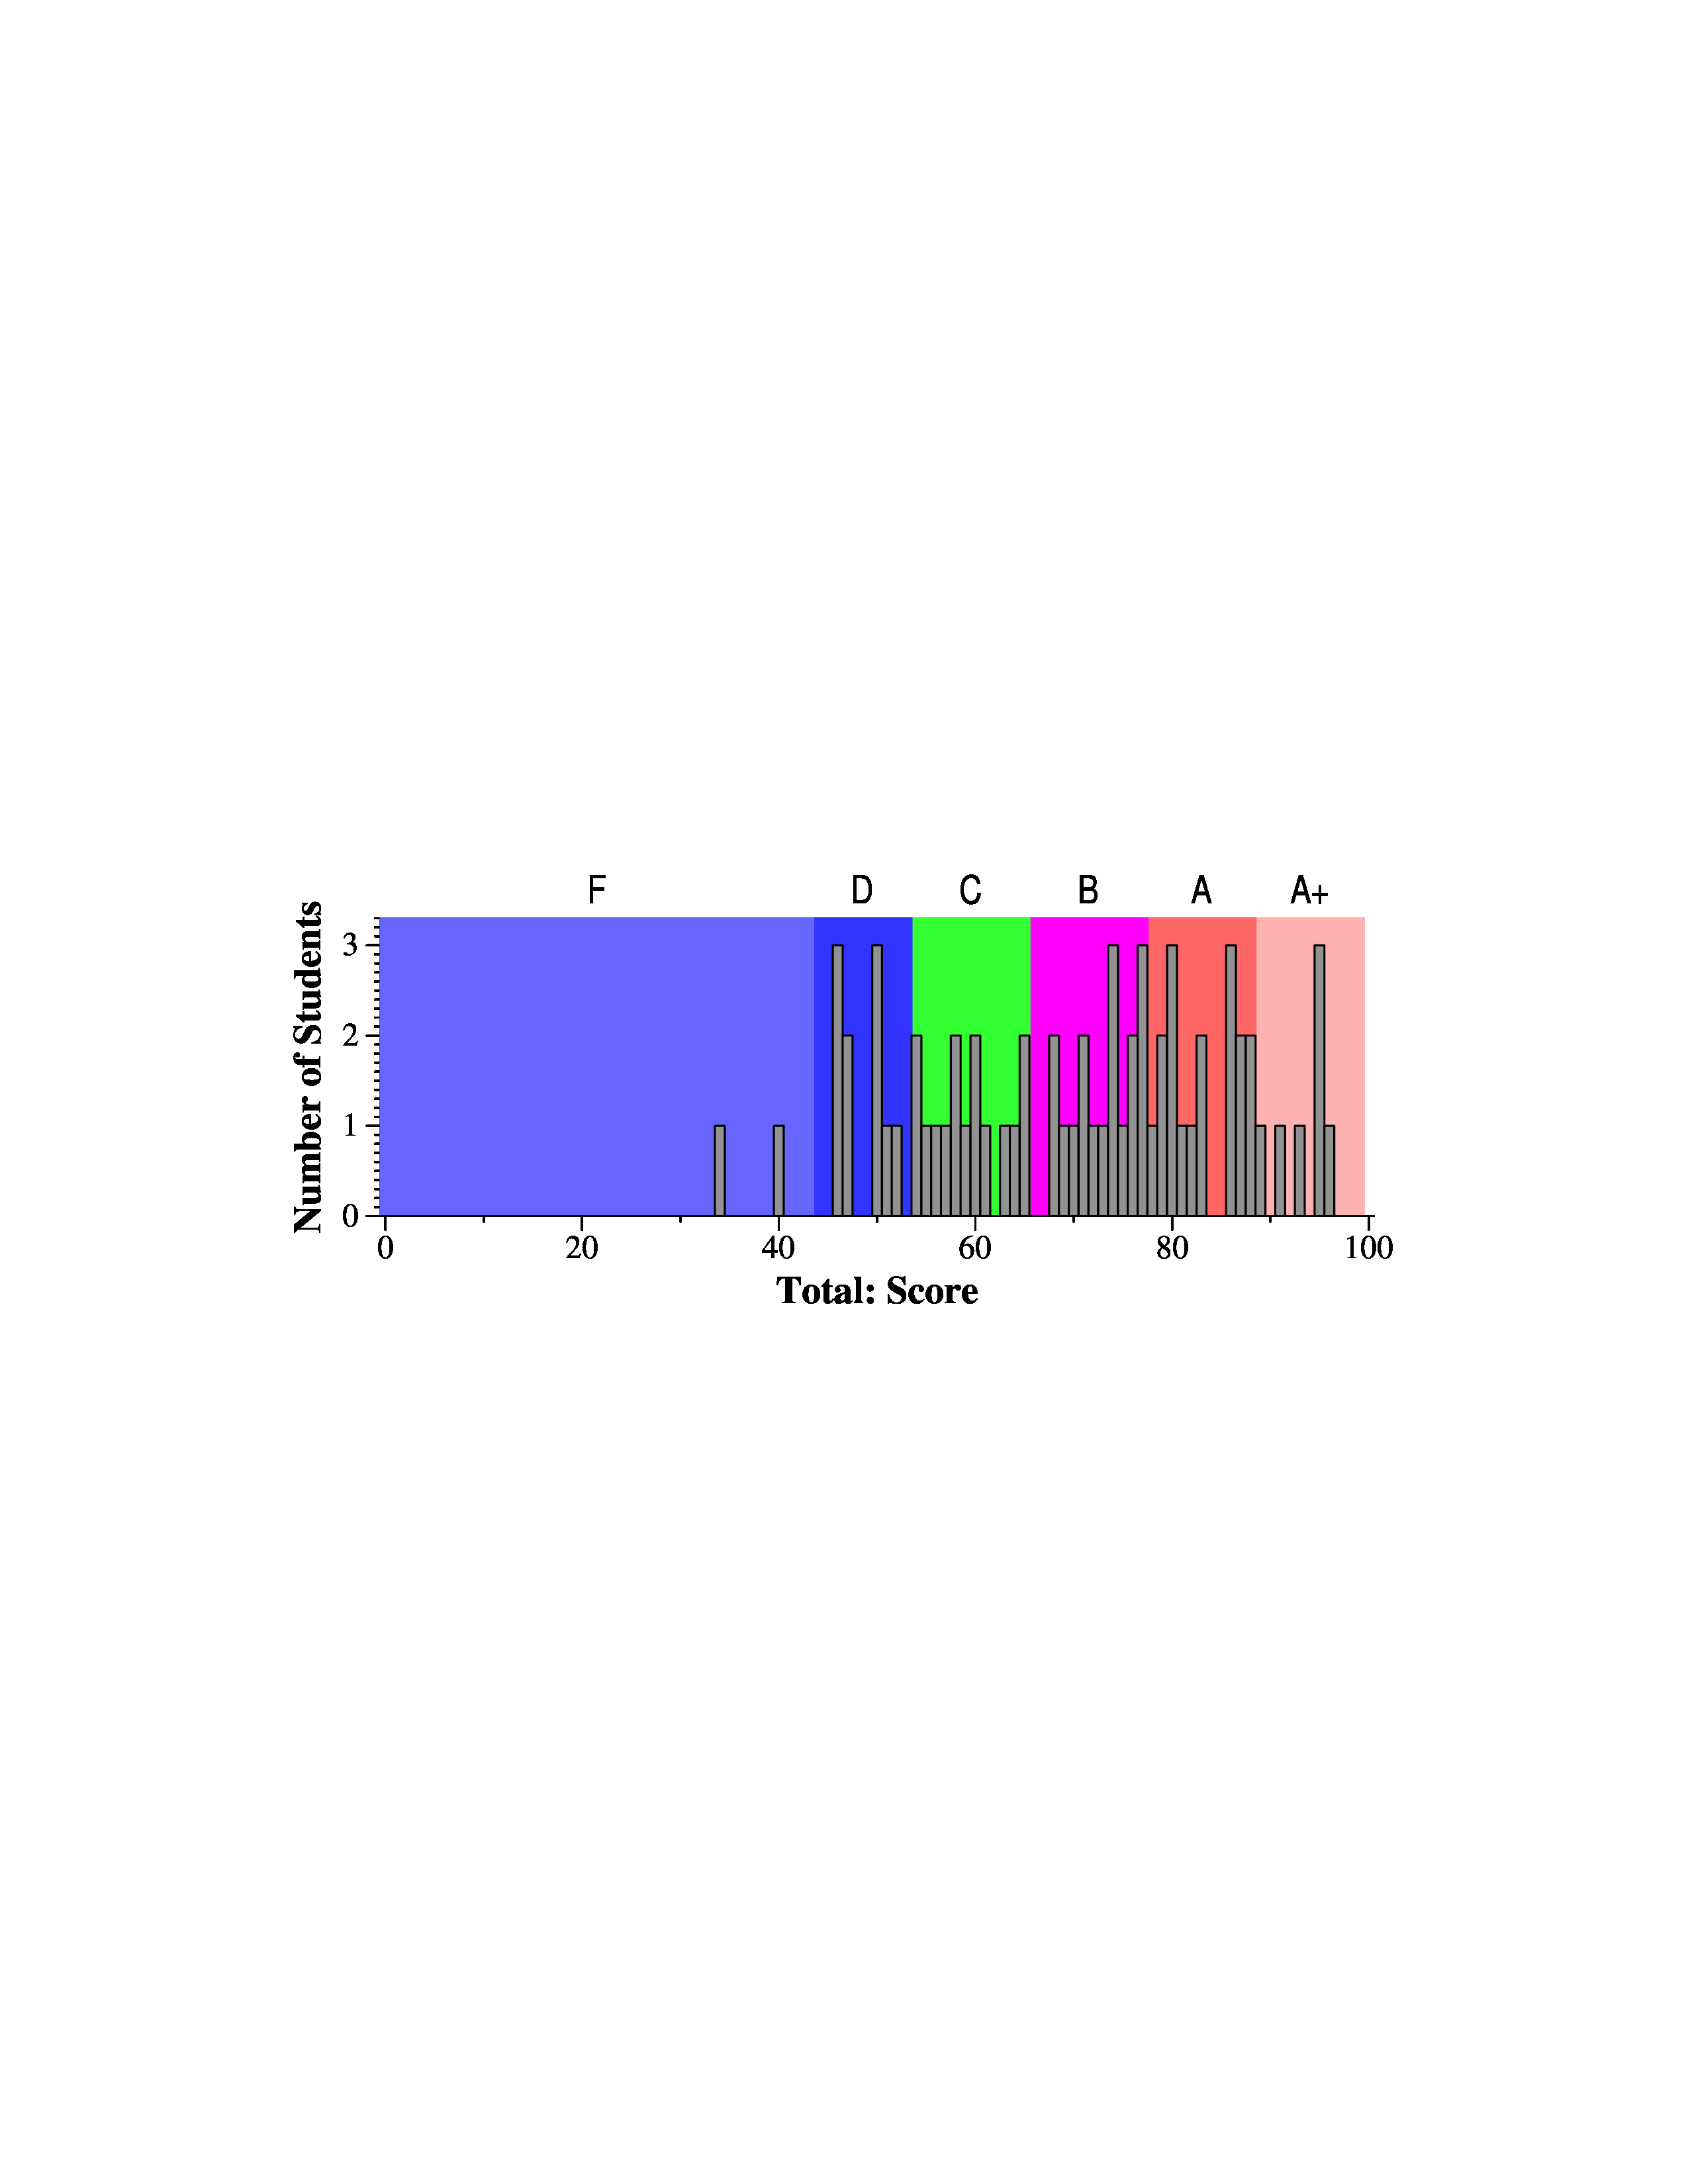
A+: 89 - 100
A: 78 - 89
B: 66 - 78
C: 54 - 66
D: 44 - 54
F: 0 - 44
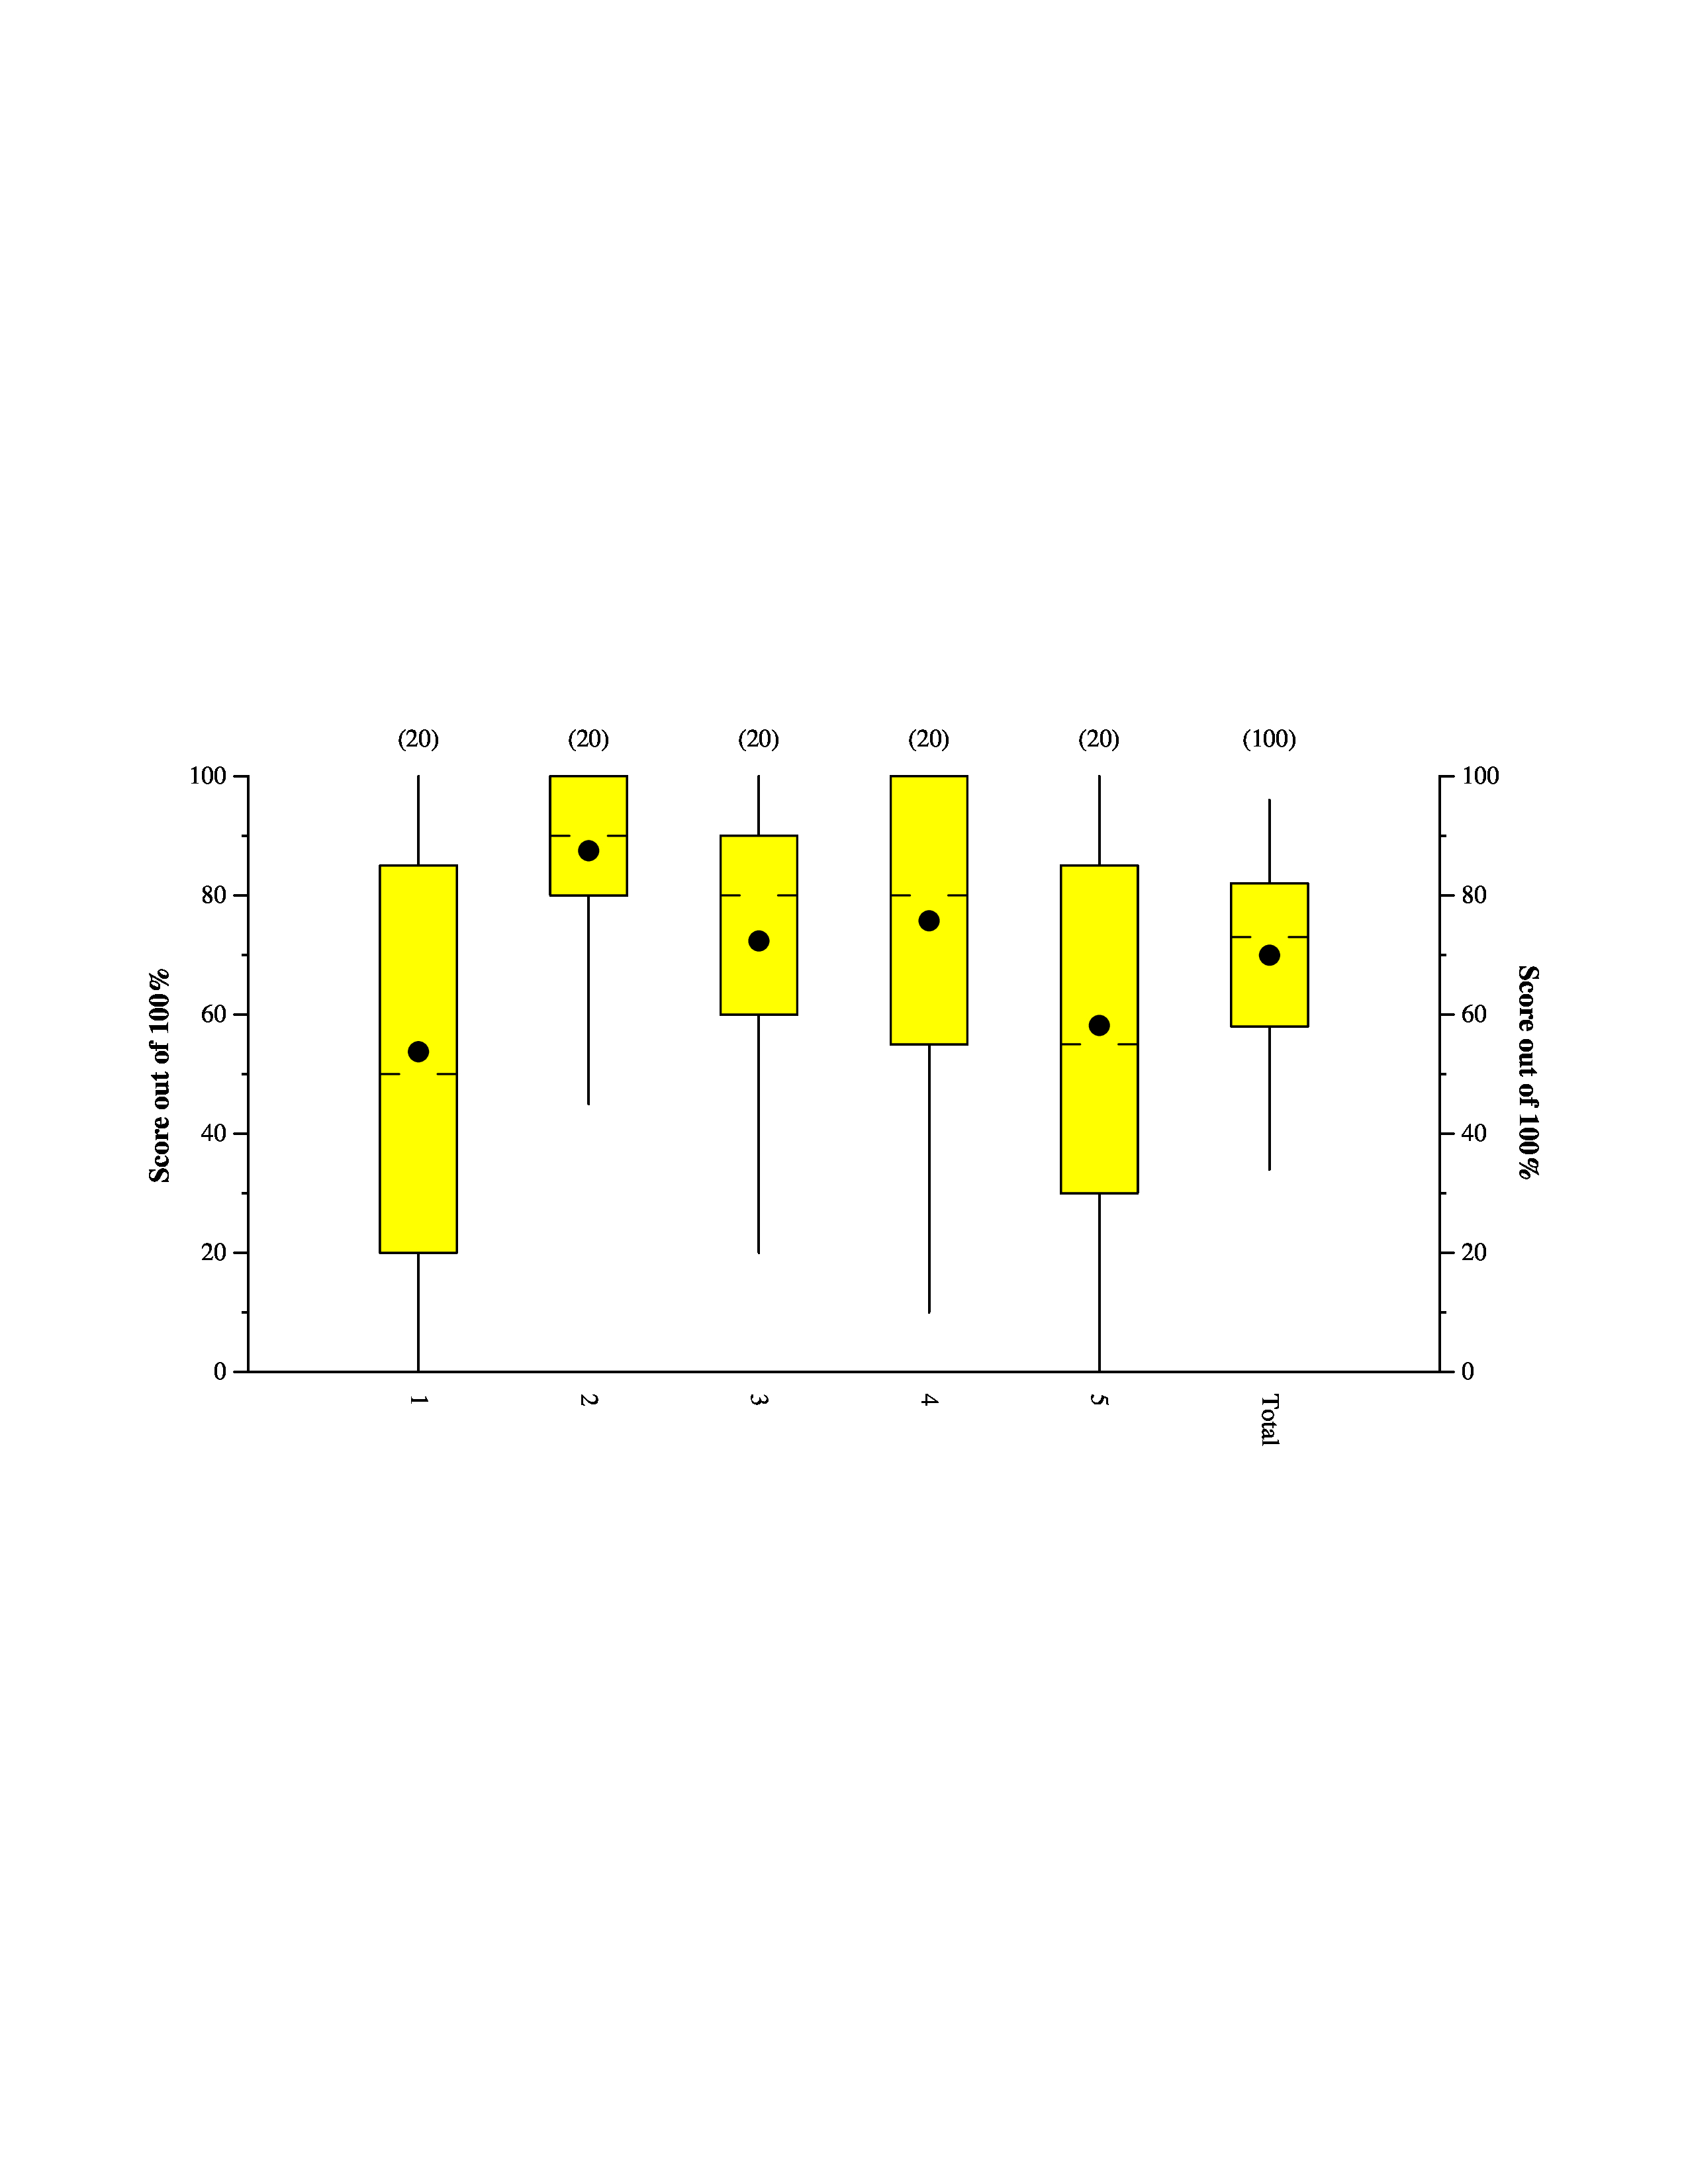
Tukey Plots
This is a Tukey Plot, which has lines to the max and min, yellow box denoting
the 1st and 3rd quartiles, hash marks at the median, and dot at the mean.