
Jgraph -- A Filter for Plotting Graphs in Postscript
James S. Plank, University of Tennessee.
Original Code: November, 1992.
Latest Revision (8.5): November, 2017.
If You Use Jgraph
Please send me a brief email (plank@cs.utk.edu)
with your name and affiliation.
Documentation of usage of my open-source code is always a
good thing for department heads,
deans and funding agencies.
Brief Description
Jgraph is a program that takes the description of a graph or graphs as
input, and produces a postscript file on the standard output. Jgraph is
ideal for plotting any mixture of scatter point graphs, line graphs,
and/or bar graphs, and embedding the output into LaTeX, or any other
text processing system that can read postscript.
The Software (version 8.6)
Jgraph is an interesting case study in old code.
- I posted it in November, 1992, and it is written in a very old-school C fashion.
- It remained unchanged for 19 years and 11 months, until some C compilers would not accept it.
So, I did a round of revisions to suppress warnings and make the compilers accept it.
No functional changes or even bug fixes. Version 8.4 was posted in October, 2012.
- We have another compiler change -- this time not accepting the old-school C habit of
not giving types to void procedures. So, we now have revision 8.5, in November of 2017,
where all void procedures are actually voids.
- And another 5 years 4 months. Now unprototyped procedures no longer default to int.
So here's revision 8.6, February, 2024, and I've purposely left out the arguments in the
prototypes. I bet it is less than 5 more years before that becomes illegal.
I find it interesting (as of writing this
in February, 2024) that a piece of C code that has been completely functional for 31+ years
has had to be revised three times now, not because the code is incorrect, but because the
compiler-writers change the definition of the language. I know I sound petulant, but there
you have it.
You can get the tar file at
http://web.eecs.utk.edu/~jplank/plank/jgraph/2024-02-15-Jgraph.tar
A set of more complex jgraph examples is available in
pub/plank/jgraph/complex_examples.shar.Z.
Jgraph is currently part of the
Debian
and the SAL
(Scientific Applications on Linux) software repositories.
It has been reported to me (2021): "I just wanted to let you know that the compiler shipping with Apple’s new ARM machines required that I pass -Wno-implicit in order to compile Jgraph. It doesn’t seem like it’s respecting -ansi for some reason... sigh"
Other interesting files
Jgraph lecture notes -- easier to read than the man page, so I've
been told.
The gif files were created with jgrtoppm (below).
- The Jgraph README file
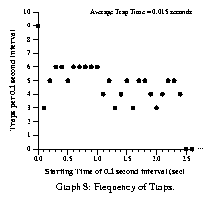
- A typical scatter graph: Input,
Output: postscript,
gif
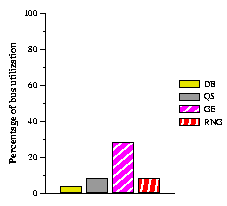
- A typical bar graph: Input,
Output: postscript,
gif
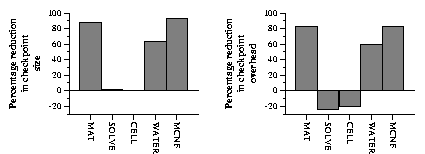
- A nice bar graph: Input,
Output: postscript,
gif
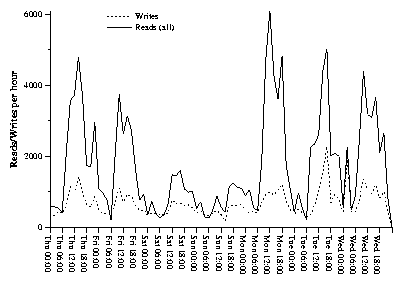
- An amazing bar graph (made by Dave Wortman):
Input,
Output
- A graph with custom axes (made by Matt Blaze):
Input,
(mab2.times),
Output: postscript,
gif
- A structured drawing (made by
Adam Buchsbaum):
Input,
Output: postscript,
gif
- The Jgraph USA-Today mock-graph:
Input,
Output: postscript,
gif
- The Jgraph football field slide:
Input,
Output
- Jgraph Overhead Slide #1 (embedded ps map of US):
Input,
Output
- Jgraph Overhead Slide #2 (typical slide):
Input,
Output
- Jgraph Overhead Slide #3 (bar graphs):
Input,
Output
- Jgraph Overhead Slide #4 (structured drawing):
Input,
Output
- Jgraph Overhead Slide #5 (made by Dave Wortman):
Input,
Output
- Jgraph Overhead Slide #6 (structured drawing -- 105K):
Input,
Output
- ctojgr -- A handy shell script to convert ascii text
files to jgraphs. E.g. Input,
Output of ctojgr,
Output of jgraph.
- Shell scripts that use ghostscript to convert jgraph files to
pnm (ppm, pgm, pbm) files. You can then use xv or
ppmtogif to convert the pnm files to gif files:
- The srm series (jgraph pictures of a "typical" computer -- varying
colors). Make an eps file out of them and include them in
drawings as an eps mark (see overhead #6 above for example use):
Black,
White (use on black),
Yellow,
Red,
Blue
- Disks --
White on black,
Black on white.
- Red Heart.
- Brief notes on an NT port, by C.M. Procter.
Related Paper
``Jgraph -- A Filter for Plotting Graphs in
PostScript'', Conference Proceedings, Usenix Winter 1993
Technical Conference, San Diego, CA, January, 1993, pp 63--68.