CS302 Final Exam -- May 1, 2008
Files
Comments
Well, two typos combined with the fact that I was at Wrigley Field made this
a little stressful. Fortunately, the first typo only made the problem less explicit --
there was really no other way to interpret the problem. And by your answers, Robert
cleared up the second typo very well.
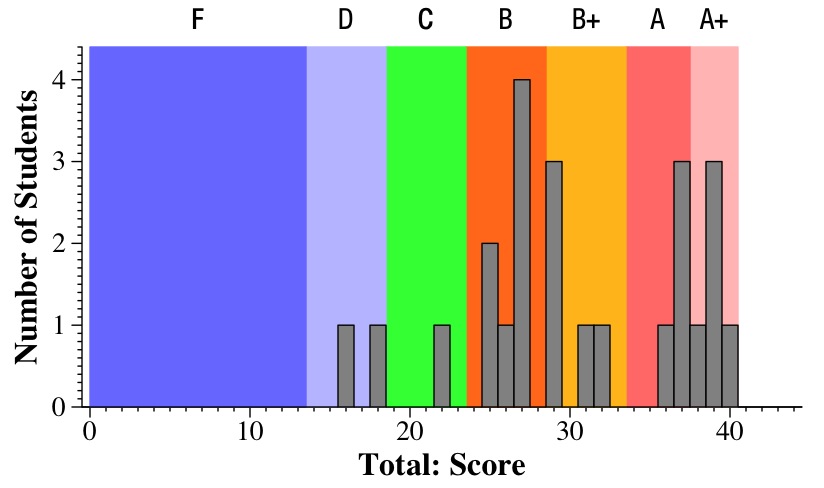
There seemed to be three groups of students -- those who simply nailed the exam (the A's),
those who pretty much knew the concepts but weren't totally on top of it (the B's), and
those who were swimming a bit (the others). The grade ranges are below:
- A+: 38 to 41
- A: 34 to 38
- B+: 29 to 34
- B: 24 to 29
- C: 19 to 24
- D: 14 to 19
- F: Below 14

Tukey Plots

This is a Tukey Plot, which has lines to the max and min, yellow box denoting
the 1st and 3rd quartiles, hash marks at the median, and dot at the mean.
In the "answers and grading", there are histograms of scores for each question.


