CS560 Midterm Exam: Spring, 2006
Scores
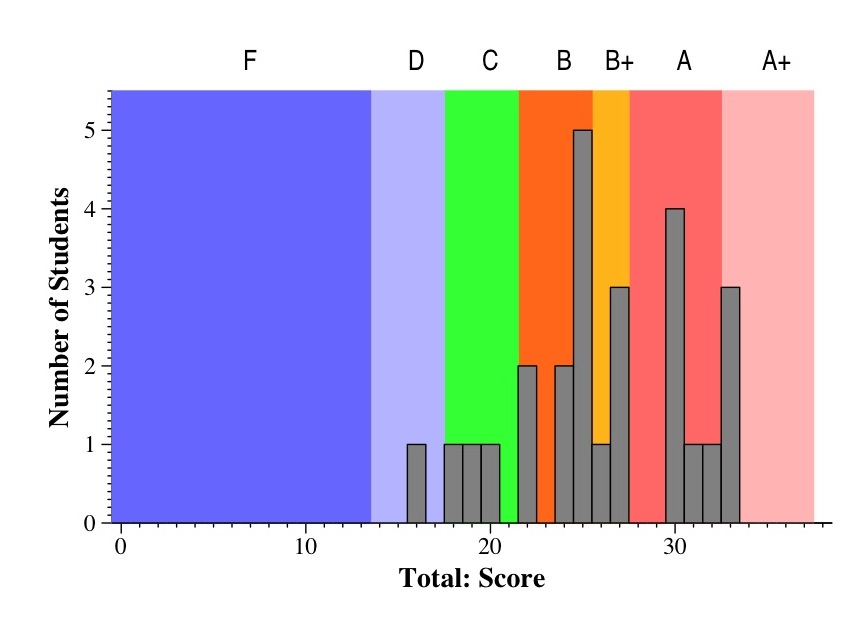
Grades are as follows:
- 33 - 38: A+
- 28 - 33: A
- 26 - 28: B+
- 22 - 26: B
- 18 - 22: C
- 14 - 18: D
- Below 14: F
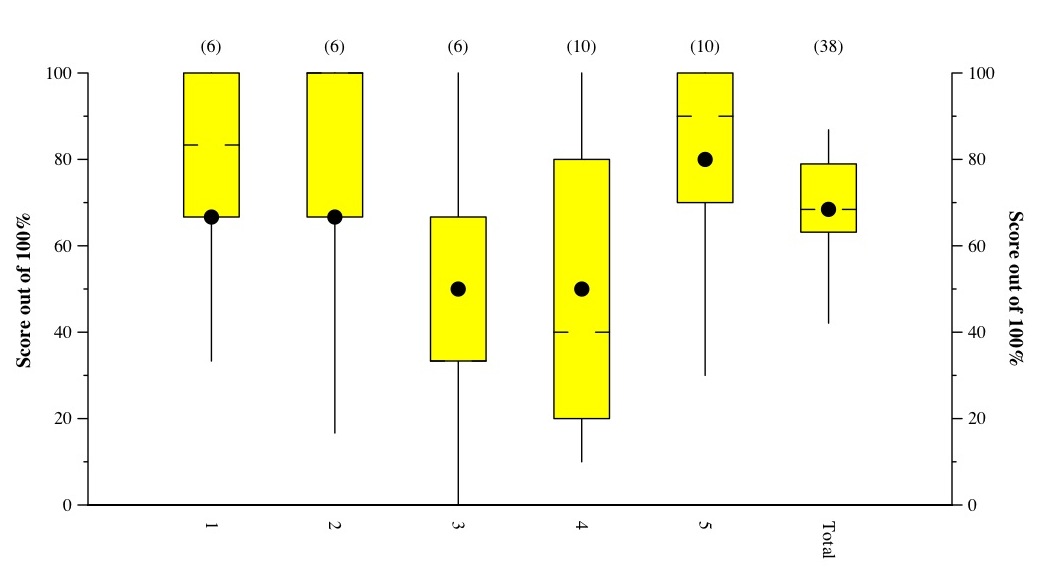
Tukey Plots:
Lines go to min & max. The box is from the first quartile to the third quartile.
The hash marks denote the median. The dot denotes the mean.
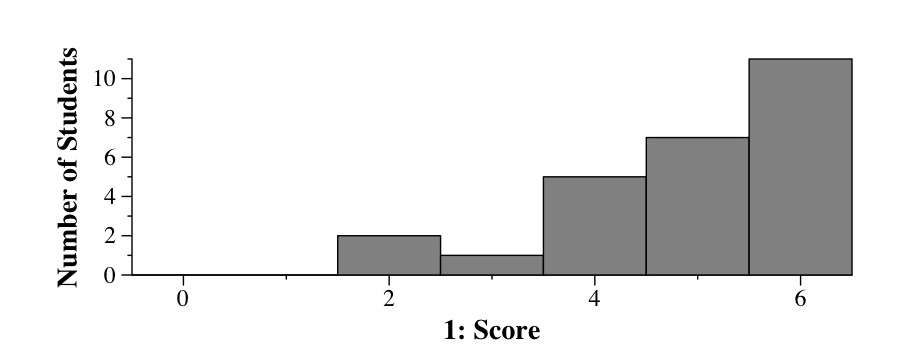
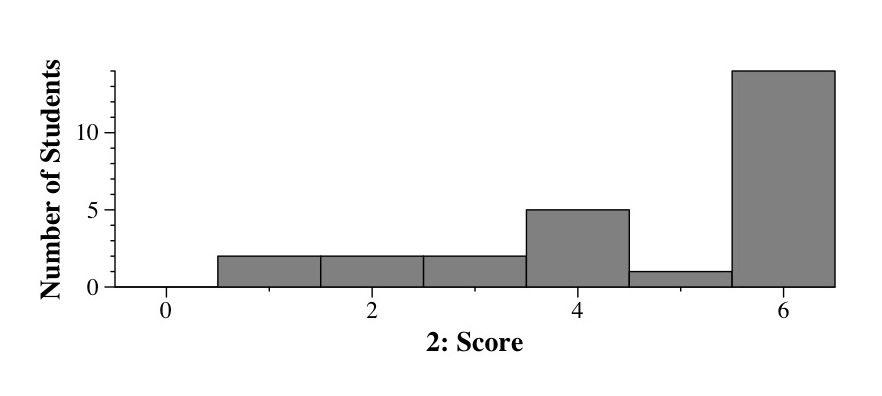
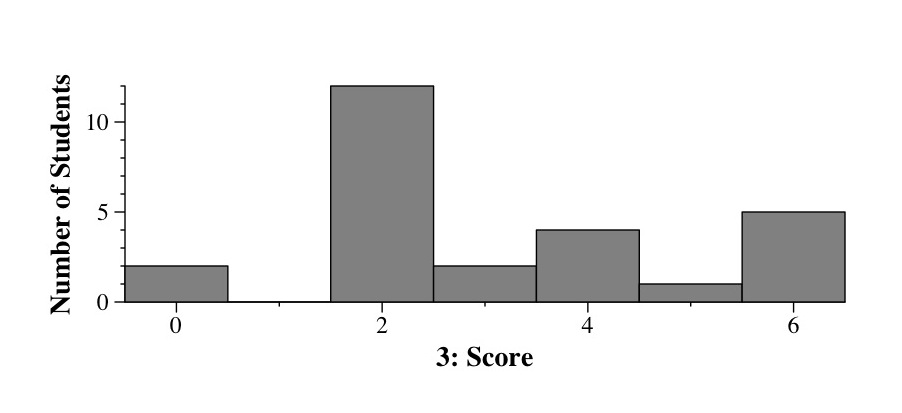
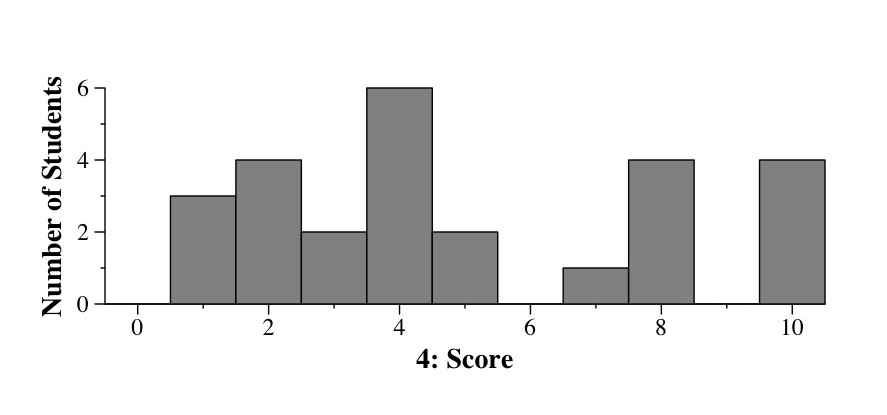
Individual Question Histograms
