 |
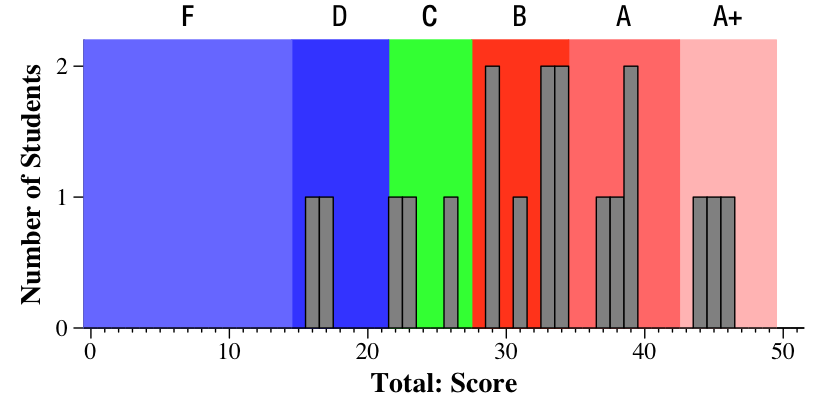
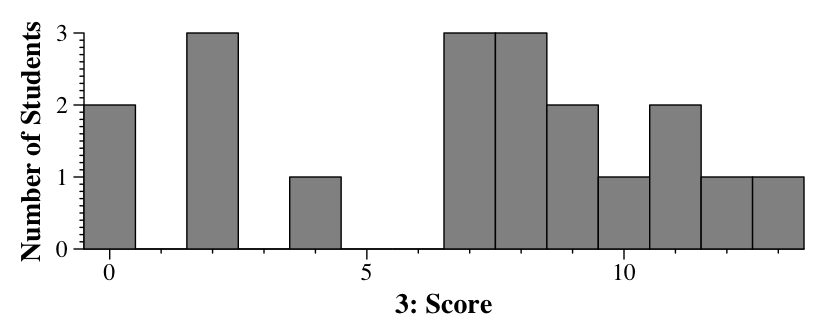
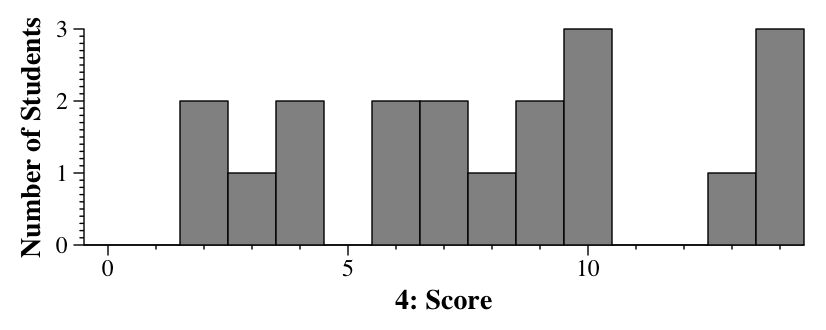
The ranges of grades are below. I am not breaking up grades into "B+" or "A-". Instead, I simply break them up into ABCD, and use those scores to calculate your final scores. When I get the final scores, I will break up the B's into A-/B+/B, and the C's into B-/C+/C.
|
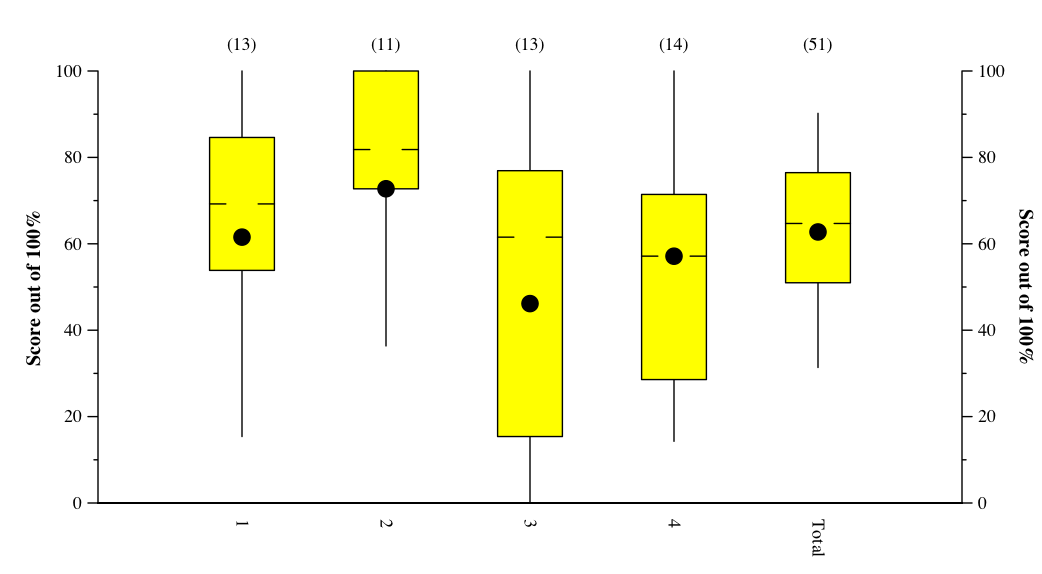 |
This is a Tukey Plot, which has lines to the max and min, yellow box denoting
the 1st and 3rd quartiles, hash marks at the median, and dot at the mean.
 |
 |
 |
 |