 Interactive Cluster Analysis
Toolkit
Interactive Cluster Analysis
Toolkit
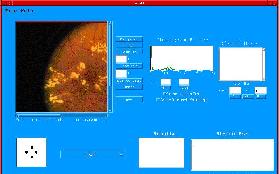
ICAT has a graphic user interface (gui) as part
of the package. This gui was created using the Java Advanced Windowing
Toolkit. Currently, this gui may only operate on networked unix machines.
No testing has been done on any other sort of networked machines, so no
guarantees can be made. This Java-based gui connects via sockets
to the main C++ code. It is the C++ code which performs the analysis.
This facilities the identification of clusters within an image. Below
is gui itself.
 (click on image for larger version)
It is the intention of this page to provide information on how ICAT's
gui performs, not to describe all the functions ensuing from using this
gui. For more information on how ICAT operates, please see the documentation
page. There is a reference to the thesis resulting from this work
and the user manual for ICAT.
Following are descriptions of each facet of the gui:
Image Window
 (click on image for larger version)
It is the image window which provides the main interaction between
the user and the image to be analyzed. An image in either XPM (X11
bitmap) or PGM (portable greymap) format is loaded into the viewing area.
From here, a user may interact with the image and its appearance, choosing
which part of the image is to be analyzed. Below the image are numerical
indicators of the current position of the mouse pointer within the image
and the intensity value at this point.
Histogram window
 (click on image for larger version)
The main purpose of the Histogram filter to to display the histogram of
the intensity image associated with the original image. Then
a user may select a range or series of ranges of intensities for use in
the analysis. These may be entered manually in the From: and
To: text boxes, or they may be selected by dragging the mouse across
the area of interest.
(click on image for larger version)
The main purpose of the Histogram filter to to display the histogram of
the intensity image associated with the original image. Then
a user may select a range or series of ranges of intensities for use in
the analysis. These may be entered manually in the From: and
To: text boxes, or they may be selected by dragging the mouse across
the area of interest.
Size range selection window
 (click on image for larger version)
The Size Filter works in a very similar manner to the Histogram Filter
in that a range or series of ranges of size may be chosen by the user for
use in the analysis. In this case, however, all ranges must be entered
manually.
(click on image for larger version)
The Size Filter works in a very similar manner to the Histogram Filter
in that a range or series of ranges of size may be chosen by the user for
use in the analysis. In this case, however, all ranges must be entered
manually.
Rule selection window
 (click on image for larger version)
It is within this window that the different neighborhood rules may
be chosen. There are six implemented with ICAT, though more may be
added. A user chooses the rule to be used by selecting the menu bar
on the right and making a choice.
(click on image for larger version)
It is within this window that the different neighborhood rules may
be chosen. There are six implemented with ICAT, though more may be
added. A user chooses the rule to be used by selecting the menu bar
on the right and making a choice.
Results window
 (click on image for larger version)
This window reports the files created by using ICAT upon a picture.
Three types of files are given in this window:
(click on image for larger version)
This window reports the files created by using ICAT upon a picture.
Three types of files are given in this window:
-
the original image,
-
the overlay images resulting from the analysis (beginning in "result"),
and
-
the textual output, also resulting from the analysis (beginning in "info").
The item of interest is chosen by clicking upon the filename. Selection
of the first two types of items will result in the display of an image.
Choosing the final type will display a window containing the resulting
overlay image as well as a scrolling text field containing the resulting
metric calculations for each cluster identified.
[Publications] [Graphic
User Interface ] [How to get a copy]
[The People involved]